Plus:TreeInnerClimate: Unterschied zwischen den Versionen
Tes (Diskussion | Beiträge) Keine Bearbeitungszusammenfassung |
Tes (Diskussion | Beiträge) |
||
| (44 dazwischenliegende Versionen desselben Benutzers werden nicht angezeigt) | |||
| Zeile 3: | Zeile 3: | ||
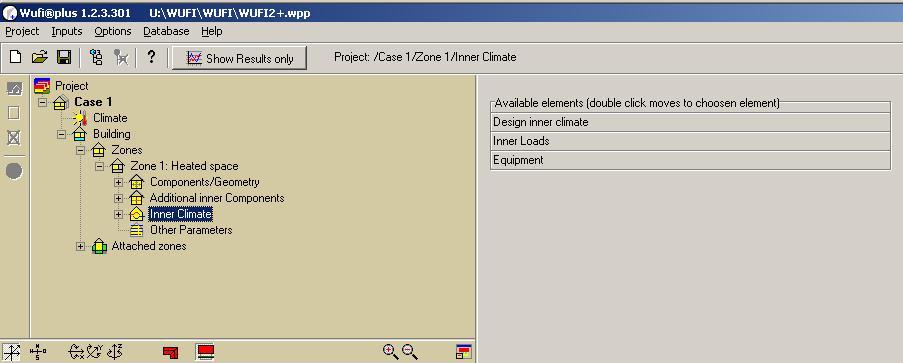
The following elements are available and to choose per double click | The following elements are available and to choose per double click | ||
* Design | * [[Plus:TreeInnerClimate#Design Conditions | Design Conditions]] | ||
* Loads | * [[Plus:TreeInnerClimate#Loads | Loads]] | ||
* Equipement | * [[Plus:TreeInnerClimate#Equipment | Equipement]] | ||
[[Bild:WUFI-PlusTreeInnerClimate.jpg]] | [[Bild:WUFI-PlusTreeInnerClimate.jpg]] | ||
== Design Conditions == | |||
[[Bild:WUFI-PlusTreeDesignConditions.jpg|thumb]] | |||
Design Conditions consists of the | |||
* Temperature min. and max | |||
* Relative Humidity min. and max. | |||
* CO<sub>2</sub>-Concentration max. | |||
* Ventilation | |||
For this layer you have different possibilities to view. | |||
You can select a view of all parameters, of one selected or of those which are checked in the checkbox. | |||
On the bottom you can define the shown period and fix a specific date in the calculation time. | |||
With a double click in the list of available elements you get to the choosen element. | |||
<br style="clear:both" /> | |||
=== Min. / Max. Temperature === | |||
[[Bild:WUFI-PlusClimateTemperatures.jpg|thumb]] | |||
In the layers of min. and max temperature you can define the temperature profile of the building. | |||
On top you can edit periods of different temperature profiles during the year. | |||
Beneath you can define the day-profiles. The day can be devided in sections of variable temperatures. | |||
The day-temperature-profile is shown as a graph at the end. | |||
<br style="clear:both" /> | |||
=== Min. / Max. Relative Humidity === | |||
[[Bild:WUFI-PlusTreeClimateRelHumidity.jpg|thumb]] | |||
In the layers of min. and max relative humidity you can define the humidity profile of the building. On top you can edit periods of different humdidity profiles during the year. | |||
Beneath you can define the day-profiles. The day can be devided in sections of variable percentages. | |||
The day-profile is shown as a graph at the end. | |||
<br style="clear:both" /> | |||
=== Max. CO<sub>2</sub>-Concentration === | |||
[[Bild:WUFI-PlusTreeClimateCOConcentration.jpg|thumb]] | |||
In the layers of max CO<sub>2</sub>-Concentration you can define the CO<sub>2</sub> profile of the building. On top you can edit periods of different CO<sub>2</sub> profiles during the year. | |||
Beneath you can define the day-profiles. The day can be devided in sections of variable concentrations. Here you can choose from different values of the concentration. | |||
The day-profile is shown as a graph at the end. | |||
<br style="clear:both" /> | |||
=== Ventilation === | |||
[[Bild:WUFI-PlusTreeClimateVentilation.jpg|thumb]] | |||
<br style="clear:both" /> | |||
== Loads == | |||
[[Bild:WUFI-PlusTreeLoads.jpg|thumb|right]] | |||
Loads consists of the | |||
* Occupancy | |||
* Additional | |||
** Heat convective | |||
** Heat radiant | |||
** Moisture | |||
** CO<sub>2</sub>-emission | |||
For this layer you have different possibilities to view. You can select a view of all parameters, of one selected or of those which are checked in the checkbox. On the bottom you can define the shown period and fix a specific date in the calculation time. | |||
<br style="clear:both" /> | |||
=== Occupancy === | |||
[[Bild:WUFI-PlusTreeLoadsOccupancy.jpg|thumb]] | |||
<br style="clear:both" /> | |||
=== Additional === | |||
[[Bild:WUFI-PlusTreeLoadsAdditional.jpg|thumb]] | |||
<br style="clear:both" /> | |||
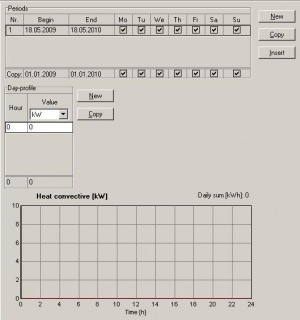
==== Heat convective ==== | |||
[[Bild:WUFI-PlusTreeLoadsAdditionalsConvective.jpg|thumb]] | |||
<br style="clear:both" /> | |||
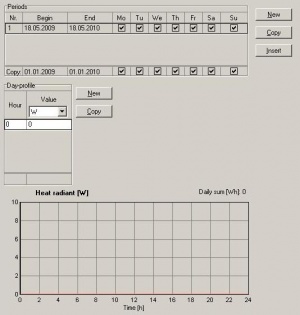
==== Heat radiant ==== | |||
[[Bild:WUFI-PlusTreeLoadsAdditionalRadiant.jpg|thumb]] | |||
<br style="clear:both" /> | |||
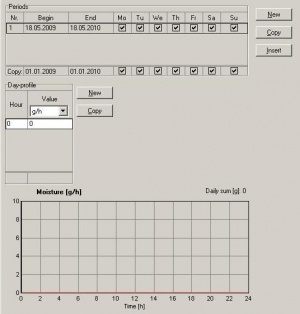
==== Moisture ==== | |||
[[Bild:WUFI-PlusTreeLoadsAdditionalMoisture.jpg|thumb]] | |||
<br style="clear:both" /> | |||
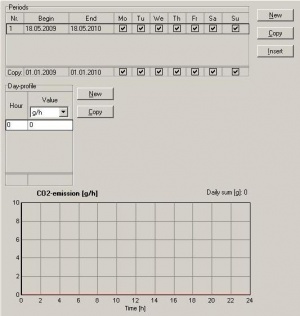
==== CO<sub>2</sub>-Emission ==== | |||
[[Bild:WUFI-PlusTreeLoadsAdditionalCO.jpg|thumb]] | |||
<br style="clear:both" /> | |||
== Equipment == | |||
[[Bild:WUFI-PlusTreeEquipment.jpg|thumb|right]] | |||
Equipment consists of the | |||
* Heating power | |||
* Cooling power | |||
* Humidification capability | |||
* Dehumidification capability | |||
* Capability of ventilation system | |||
For this layer you have different possibilities to view. You can select a view of all parameters, of one selected or of those which are checked in the checkbox. On the bottom you can define the shown period and fix a specific date in the calculation time. | |||
=== Heating power === | |||
=== Cooling power === | |||
=== Humidification capability === | |||
=== Dehumidification capability === | |||
=== Capability of ventilation system === | |||
Aktuelle Version vom 21. Juli 2009, 08:26 Uhr
Inner Climate
The following elements are available and to choose per double click
Design Conditions
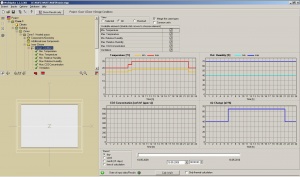
Design Conditions consists of the
- Temperature min. and max
- Relative Humidity min. and max.
- CO2-Concentration max.
- Ventilation
For this layer you have different possibilities to view. You can select a view of all parameters, of one selected or of those which are checked in the checkbox. On the bottom you can define the shown period and fix a specific date in the calculation time.
With a double click in the list of available elements you get to the choosen element.
Min. / Max. Temperature
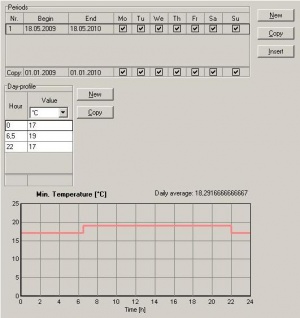
In the layers of min. and max temperature you can define the temperature profile of the building. On top you can edit periods of different temperature profiles during the year.
Beneath you can define the day-profiles. The day can be devided in sections of variable temperatures.
The day-temperature-profile is shown as a graph at the end.
Min. / Max. Relative Humidity
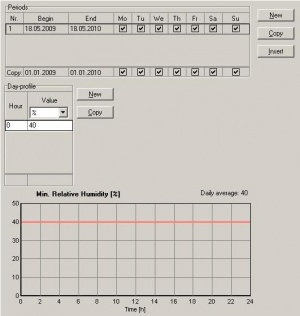
In the layers of min. and max relative humidity you can define the humidity profile of the building. On top you can edit periods of different humdidity profiles during the year.
Beneath you can define the day-profiles. The day can be devided in sections of variable percentages.
The day-profile is shown as a graph at the end.
Max. CO2-Concentration
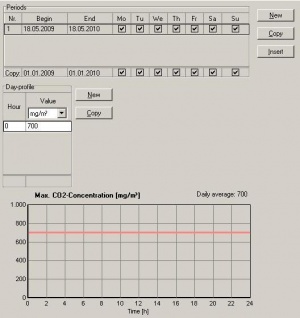
In the layers of max CO2-Concentration you can define the CO2 profile of the building. On top you can edit periods of different CO2 profiles during the year.
Beneath you can define the day-profiles. The day can be devided in sections of variable concentrations. Here you can choose from different values of the concentration.
The day-profile is shown as a graph at the end.
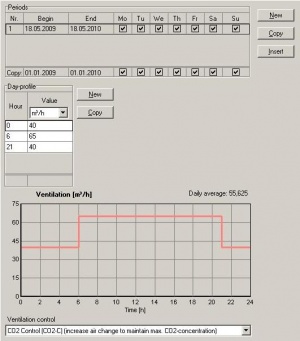
Ventilation
Loads
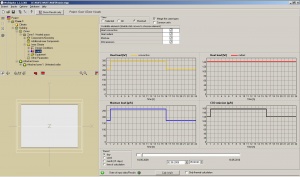
Loads consists of the
- Occupancy
- Additional
- Heat convective
- Heat radiant
- Moisture
- CO2-emission
For this layer you have different possibilities to view. You can select a view of all parameters, of one selected or of those which are checked in the checkbox. On the bottom you can define the shown period and fix a specific date in the calculation time.
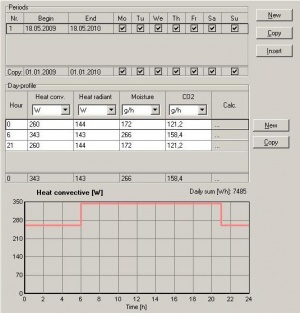
Occupancy
Additional

Heat convective
Heat radiant
Moisture
CO2-Emission
Equipment
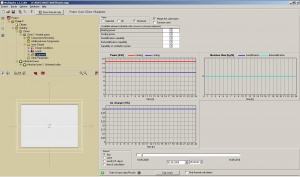
Equipment consists of the
- Heating power
- Cooling power
- Humidification capability
- Dehumidification capability
- Capability of ventilation system
For this layer you have different possibilities to view. You can select a view of all parameters, of one selected or of those which are checked in the checkbox. On the bottom you can define the shown period and fix a specific date in the calculation time.
