Plus:Example: Unterschied zwischen den Versionen
SebSta (Diskussion | Beiträge) Keine Bearbeitungszusammenfassung |
SebSta (Diskussion | Beiträge) Keine Bearbeitungszusammenfassung |
||
| (2 dazwischenliegende Versionen desselben Benutzers werden nicht angezeigt) | |||
| Zeile 1: | Zeile 1: | ||
This short example shows you step by step how to input and calculate a case in WUFI® Plus. There is also a [http://www.wufi-wiki.com/wufifilme/Plus/Plus_%20Simple%20Example_latest.mp4 '''movie'''] demonstrating all the steps. <br> | This short example shows you step by step how to input and calculate a case in WUFI® Plus. There is also a [http://www.wufi-wiki.com/wufifilme/Plus/Plus_%20Simple%20Example_latest.mp4 '''movie'''] demonstrating all the steps. <br> | ||
<rb> | <rb> | ||
The goal of this guide is to create the following building: | The goal of this guide is to create the following building:<br> | ||
[[Bild:Plus Example 01 building.png|Figure 1: |center|frame|Figure 1: ]] | [[Bild:Plus Example 01 building.png|Figure 1: |center|frame|Figure 1: ]]<br> | ||
Additional information: | Additional information: | ||
* Footprint: 12.0 m x 9.0 m | * Footprint: 12.0 m x 9.0 m | ||
| Zeile 14: | Zeile 14: | ||
== Step 01: Creating a new project== | == Step 01: Creating a new project== | ||
Start a new project by clicking the “New project”-button (1). Then open the “Case”-dialog (2) and enter general settings for the simulation: Give a | Start a new project by clicking the “New project”-button (1). Then open the “Case”-dialog (2) and enter general settings for the simulation: Give a significant name (3) and adjust the start and end date for the calculation (5) so that the simulation time is one year. In this example we use the hygrothermal calculation mode, make sure that this option is set (4). | ||
[[Bild:Plus Example 02 NewProject.png|Figure 1: Case 2|center|800px|Figure 2: ]] | [[Bild:Plus Example 02 NewProject.png|Figure 1: Case 2|center|800px|Figure 2: ]]<br> | ||
== Step 02: Defining climatic conditions== | == Step 02: Defining climatic conditions== | ||
In the second step we adjust the outdoor climatic conditions in the | In the second step we adjust the outdoor climatic conditions in the “Localization/ Climate”-dialog. In this example we use a climate file from the WUFI® Database, which can be opened by selecting “From map (database)” (1) and then clicking the “Browse”-button (2). In the “Database”-Window select the “Moisture Reference Year” for the location “Holzkirchen” in Europe (4). The database can easily be searched by name with the “Search pattern” (3).<br> | ||
[[Bild:Plus Example 03 Climate01.png|Figure 1: Case 1|center||800px|Figure 3: ]] | [[Bild:Plus Example 03 Climate01.png|Figure 1: Case 1|center||800px|Figure 3: ]]<br> | ||
After the outdoor climate was selected a summary of temperature, moisture, radiation and rain can be seen in the “Data” and “Analyze”-tab. | After the outdoor climate was selected a summary of temperature, moisture, radiation and rain can be seen in the “Data” and “Analyze”-tab. | ||
[[Bild:Plus Example 04 Climate02.png|Figure 1: Case 1|center|800px|Figure 4: ]] | [[Bild:Plus Example 04 Climate02.png|Figure 1: Case 1|center|800px|Figure 4: ]]<br> | ||
Furthermore an optional climate has to be defined which represents the soil climate in this example. It will be applied to all components in contact with the ground. An optional climate can be defined in the “Optional Climates”-tab (1) by clicking the “New”-button (2). Now its type has to be selected (3). Sine curves are a good way to describe the soil climate, so we use this type and give it an appropriate name (4). | Furthermore an optional climate has to be defined which represents the soil climate in this example. It will be applied to all components in contact with the ground. An optional climate can be defined in the “Optional Climates”-tab (1) by clicking the “New”-button (2). Now its type has to be selected (3). Sine curves are a good way to describe the soil climate, so we use this type and give it an appropriate name (4).<br> | ||
[[Bild:Plus Example 05 OptionalClimate01.png|Figure 1: Case 1|center|800px|Figure 5:]] | [[Bild:Plus Example 05 OptionalClimate01.png|Figure 1: Case 1|center|800px|Figure 5:]]<br> | ||
As none of the preset sine curves represent soil climate, we define a “User defined sine curve” (1) and enter these values (2): | As none of the preset sine curves represent soil climate, we define a “User defined sine curve” (1) and enter these values (2): | ||
* Temperature: sine curve; mean value 6 °C; amplitude 5.5 K; day of maximum 16th of August. | * Temperature: sine curve; mean value 6 °C; amplitude 5.5 K; day of maximum 16th of August. | ||
| Zeile 33: | Zeile 33: | ||
[[Bild:Plus Example 06 optionalclimate02.png|Figure 1: Case 1|center|800px|Figure 6]] | [[Bild:Plus Example 06 optionalclimate02.png|Figure 1: Case 1|center|800px|Figure 6]]<br> | ||
Please note that the values entered in this dialog depend strongly on your | Please note that the values entered in this dialog depend strongly on your selected location and therefore should not be used in other projects. | ||
== Step 03: Creating building geometry== | == Step 03: Creating building geometry== | ||
In this example we use the “Building Wizard” to create the geometry of our building. This is one of multiple options to enter a building geometry into WU-FI® Plus, please refer to chapter 4.5.1 for further information about the other ones. | In this example we use the “Building Wizard” to create the geometry of our building. This is one of multiple options to enter a building geometry into WU-FI® Plus, please refer to chapter 4.5.1 for further information about the other ones.<br> | ||
Start the “Building Wizard” by clicking on the respective button in the “Build-ing”-dialog. The example building has a rectangular footprint, an unheated | Start the “Building Wizard” by clicking on the respective button in the “Build-ing”-dialog. The example building has a rectangular footprint, an unheated attic and a slab on ground. The orientation of the main-facade is south-west. This information can be entered into the “Building Wizard” together with the associated measurements:<br> | ||
[[Bild: Plus Example 07 BuildingWizard.png |Figure 1: Case 1|center|800px|Figure 7]] | [[Bild: Plus Example 07 BuildingWizard.png |Figure 1: Case 1|center|800px|Figure 7]]<br> | ||
Close the “Building Wizard” with the “OK”-button and the geometry of the building is created automatically: All zones and components are generated according to the input in the “Building Wizard” and can be selected in the “Project Tree”. Also, a 3D-visualization is shown in the “Visualization Box”. | Close the “Building Wizard” with the “OK”-button and the geometry of the building is created automatically: All zones and components are generated according to the input in the “Building Wizard” and can be selected in the “Project Tree”. Also, a 3D-visualization is shown in the “Visualization Box”.<br> | ||
No advanced calculation options will be used in this example. So no user input is necessary in the “Numerics”-tab of the “Building”-dialog. Only the checkbox for “Include shading calculation” should be check marked. | No advanced calculation options will be used in this example. So no user input is necessary in the “Numerics”-tab of the “Building”-dialog. Only the checkbox for “Include shading calculation” should be check marked. | ||
== Step 04: Including a window== | == Step 04: Including a window== | ||
In this step a window is included into the south-western wall of the example building. To create a window select the respective wall in the “Visualization Box”, check its normal vector as described in chapter 3.4.2 and then click the “Windows/ Openings”-button: | In this step a window is included into the south-western wall of the example building. To create a window select the respective wall in the “Visualization Box”, check its normal vector as described in chapter 3.4.2 and then click the “Windows/ Openings”-button: | ||
[[Bild:Plus Example 08 VisBox.png|Figure 1: Case 1|center|800px|Figure 8]] | [[Bild:Plus Example 08 VisBox.png|Figure 1: Case 1|center|800px|Figure 8]]<br> | ||
The “Component openings”-dialog opens. First, check the direction of the view on the component (1), to ensure that the entered window appears in the desired place. The view-direction can be switched with the “Change View”-button (3). In this example, we use the view from outside. Next, click the “New”-button (2) to add the type (4), position (5) and size (6) of the window in this wall. Confirm your input with the “OK”-button and the new window is inserted in the wall and appears both in visualization and the “Project Tree”. | The “Component openings”-dialog opens. First, check the direction of the view on the component (1), to ensure that the entered window appears in the desired place. The view-direction can be switched with the “Change View”-button (3). In this example, we use the view from outside. Next, click the “New”-button (2) to add the type (4), position (5) and size (6) of the window in this wall. Confirm your input with the “OK”-button and the new window is inserted in the wall and appears both in visualization and the “Project Tree”.<br> | ||
[[Bild:Plus Example 09 WindowDial.png|Figure 1: Case 1|center|800px|Figure 9]]No other windows are included in this simple example. | [[Bild:Plus Example 09 WindowDial.png|Figure 1: Case 1|center|800px|Figure 9]]<br> | ||
No other windows are included in this simple example. | |||
== Step 05: Defining the visualized components== | == Step 05: Defining the visualized components== | ||
The example building consists of four visualized components that surround the simulated zone: Floor slab, ceiling, exterior wall and the window. In this step we define the assemblies and additional parameters of these four components. | The example building consists of four visualized components that surround the simulated zone: Floor slab, ceiling, exterior wall and the window. In this step we define the assemblies and additional parameters of these four components. | ||
=== Exterior Walls === | === Exterior Walls === | ||
We start with the exterior walls. Select the component in the “Project Tree” (1) and its general information is shown. Enter a significant name (2) and check if the type and attachments on the inner and outer sides (3) are correct. The name of the component appears also in the “Project Tree” to facilitate navigation in the project. | We start with the exterior walls. Select the component in the “Project Tree” (1) and its general information is shown. Enter a significant name (2) and check if the type and attachments on the inner and outer sides (3) are correct. The name of the component appears also in the “Project Tree” to facilitate navigation in the project. <br> | ||
[[Bild: Plus Example 10 ExtWall01.png |Figure 1: Case 1|center|800px|Figure 10]] | [[Bild: Plus Example 10 ExtWall01.png |Figure 1: Case 1|center|800px|Figure 10]]<br> | ||
Next, the assembly of the component has to be defined, so switch to the “As-sembly”-tab. For this example, we use a predefined assembly from the WUFI® Plus Database, a lightweight timber framed wall. Click “Select from Database” (1) and the Database opens. Use the “Search pattern” (2) to find the desired assembly (“Lightweight timber framed wall”), as shown in the figure below. By clicking the “Apply”-button (3) the selected assembly from the database is applied to the exterior walls of our example. | Next, the assembly of the component has to be defined, so switch to the “As-sembly”-tab. For this example, we use a predefined assembly from the WUFI® Plus Database, a lightweight timber framed wall. Click “Select from Database” (1) and the Database opens. Use the “Search pattern” (2) to find the desired assembly (“Lightweight timber framed wall”), as shown in the figure below. By clicking the “Apply”-button (3) the selected assembly from the database is applied to the exterior walls of our example. <br> | ||
[[Bild: Plus Example 11 ExtWall02.png |Figure 1: Case 1|center|800px|Figure 11]] | [[Bild: Plus Example 11 ExtWall02.png |Figure 1: Case 1|center|800px|Figure 11]]<br> | ||
Settings for the hygrothermal conditions on the components surfaces can be defined in the “Surface”-tab. On the “Thermal” side we adjust the solar ab-sorption and emission coefficients for the exterior surface and select predefined values for “Stucco, normal bright”: | Settings for the hygrothermal conditions on the components surfaces can be defined in the “Surface”-tab. On the “Thermal” side we adjust the solar ab-sorption and emission coefficients for the exterior surface and select predefined values for “Stucco, normal bright”:<br> | ||
[[Bild:Plus Example 12 ExtWall03.png|Figure 1: Case 1|center|800px|Figure 12]] | [[Bild:Plus Example 12 ExtWall03.png|Figure 1: Case 1|center|800px|Figure 12]]<br> | ||
For this component, the surface conditions for “Moisture” and “Climate on outer surface” remain unchanged. Also, settings for the “Initial Conditions” and special calculation options in the “Numerics”-tab stay with their preset standard values. | For this component, the surface conditions for “Moisture” and “Climate on outer surface” remain unchanged. Also, settings for the “Initial Conditions” and special calculation options in the “Numerics”-tab stay with their preset standard values. | ||
In the “Report: Data & results”-tab the option “Retain calculation results” is check marked. Now WUFI® Plus saves all calculation results for this component and they can be evaluated after the simulation. | In the “Report: Data & results”-tab the option “Retain calculation results” is check marked. Now WUFI® Plus saves all calculation results for this component and they can be evaluated after the simulation.<br> | ||
As we want to retain the calculation results for all other components of the simulated zone, too, we use the “Assign data”-function to set this option for them. This function saves time, as it allows setting certain parameters for a selection of other components automatically. Click the “Assign data”-button (1) in the “Tool Bar” and the “Assign data”-window opens as in the figure below. On the right side (3), all parameters are listed that can be assigned to other components, in this case, only “Retain calculation results” is listed. On the left side (2), all available components are listed. Select all components of the simulated zone, then click the “OK”-button and confirm in the next dialog, that the existing settings of the other components will be overwritten. Now, the calculation results of all components will be retained after the simulation. | As we want to retain the calculation results for all other components of the simulated zone, too, we use the “Assign data”-function to set this option for them. This function saves time, as it allows setting certain parameters for a selection of other components automatically. Click the “Assign data”-button (1) in the “Tool Bar” and the “Assign data”-window opens as in the figure below. On the right side (3), all parameters are listed that can be assigned to other components, in this case, only “Retain calculation results” is listed. On the left side (2), all available components are listed. Select all components of the simulated zone, then click the “OK”-button and confirm in the next dialog, that the existing settings of the other components will be overwritten. Now, the calculation results of all components will be retained after the simulation. <br> | ||
[[Bild:Plus Example 13 ExtWall04.png|Figure 1: Case 1|center|800px|Figure 13]]The settings for the exterior wall are complete. Proceed with the next | [[Bild:Plus Example 13 ExtWall04.png|Figure 1: Case 1|center|800px|Figure 13]]<br> | ||
The settings for the exterior wall are complete. Proceed with the next component. | |||
=== Ceiling=== | === Ceiling=== | ||
The next assembly is the ceiling. We proceed in the same way as for the exterior wall: Name the component, check the type and the inner and outer attachments. | The next assembly is the ceiling. We proceed in the same way as for the exterior wall: Name the component, check the type and the inner and outer attachments. <br> | ||
Again, use an assembly from the database. Search for “Flat Roof#1” and assign this assembly: | Again, use an assembly from the database. Search for “Flat Roof#1” and assign this assembly:<br> | ||
[[Bild:Plus Example 14 Ceiling.png |Figure 1: Case 1|center|800px|Figure 14]] | [[Bild:Plus Example 14 Ceiling.png |Figure 1: Case 1|center|800px|Figure 14]]<br> | ||
All other settings for this component remain at their default values. As the “Assign data”-function was used before, the calculation results for the ceiling will be retained. | All other settings for this component remain at their default values. As the “Assign data”-function was used before, the calculation results for the ceiling will be retained. | ||
=== Window=== | === Window=== | ||
For the window we proceed as before: First, naming and checking the data in the “General”-tab. Then select a window type from the database, which works the same as with the assemblies described before. Search for “Uncoated double glazing” and apply the window: | For the window we proceed as before: First, naming and checking the data in the “General”-tab. Then select a window type from the database, which works the same as with the assemblies described before. Search for “Uncoated double glazing” and apply the window:<br> | ||
[[Bild:Plus Example 15 Window.png|Figure 1: Case 1|center|800px|Figure 15]] | [[Bild:Plus Example 15 Window.png|Figure 1: Case 1|center|800px|Figure 15]]<br> | ||
Window parameters can be altered by clicking the “Edit”-button in the | Window parameters can be altered by clicking the “Edit”-button in the “Window parameters”-tab. However, in this example the settings from the database remain unchanged. Also no settings are made in the “Surface”-tab and no solar protection is added. | ||
=== Floor Slab=== | === Floor Slab=== | ||
The last component is the floor slab. Name it and check the settings in the “General”-tab. This time no assembly from the database is used hence a new one has to be defined. Click the “Edit”-button in the “Assembly”-tab and the “Edit assembly”-window opens: | The last component is the floor slab. Name it and check the settings in the “General”-tab. This time no assembly from the database is used hence a new one has to be defined. Click the “Edit”-button in the “Assembly”-tab and the “Edit assembly”-window opens:<br> | ||
[[Bild:Plus Example 16 BottomPlate01.png|Figure 1: Case 1|center|800px|Figure 16]] | [[Bild:Plus Example 16 BottomPlate01.png|Figure 1: Case 1|center|800px|Figure 16]]<br> | ||
At first, name the assembly, in this case “Floor Slab” (1). Each assembly is built from different material layers. The construction of the exemplary floor slab is summarized in this table, starting from outside to inside: | At first, name the assembly, in this case “Floor Slab” (1). Each assembly is built from different material layers. The construction of the exemplary floor slab is summarized in this table, starting from outside to inside:<br> | ||
{| | {| | ||
|'''Nr.''' | |'''Nr.''' | ||
| Zeile 112: | Zeile 114: | ||
|Concrete, w/c=0,5 | |Concrete, w/c=0,5 | ||
|0,200 | |0,200 | ||
|} | |}<br> | ||
Click the “New”-button (2) to add a new material layer. The “Material Data-base” will open. Search for “XPS Surface Skin” and add this material to the assembly by clicking the “Apply”-button: | Click the “New”-button (2) to add a new material layer. The “Material Data-base” will open. Search for “XPS Surface Skin” and add this material to the assembly by clicking the “Apply”-button:<br> | ||
[[Bild: Plus Example 17 BottomPlate02.png |Figure 1: Case 1|center|800px|Figure 17]]The material appears now in the “Edit assembly”-window. Check, if the thickness is entered correctly and alter it, if necessary: | [[Bild: Plus Example 17 BottomPlate02.png |Figure 1: Case 1|center|800px|Figure 17]]<br> | ||
The material appears now in the “Edit assembly”-window. Check, if the thickness is entered correctly and alter it, if necessary:<br> | |||
[[Bild:Plus Example 18 BottomPlate03.png|Figure 1: Case 1|center|800px|Figure 18]]Proceed like this and add all other material layers. When finished, the assembly should look like this: | [[Bild:Plus Example 18 BottomPlate03.png|Figure 1: Case 1|center|800px|Figure 18]]<br> | ||
Proceed like this and add all other material layers. When finished, the assembly should look like this:<br> | |||
[[Bild:Plus Example 19 BottomPlate04.png|Figure 1: Case 1|center|800px|Figure 19]]Click the “OK”-button and the assembly is assigned to the component. | [[Bild:Plus Example 19 BottomPlate04.png|Figure 1: Case 1|center|800px|Figure 19]]<br> | ||
As the floor slab is attached to the ground on its exterior side, the climate on the exterior surface of the component has to be defined separately. This can be done in the “Surface”-tab under “Climate on outer surface”. Click on the dropdown-menu besides “Optional Climate” and select the optional soil | Click the “OK”-button and the assembly is assigned to the component.<br> | ||
As the floor slab is attached to the ground on its exterior side, the climate on the exterior surface of the component has to be defined separately. This can be done in the “Surface”-tab under “Climate on outer surface”. Click on the dropdown-menu besides “Optional Climate” and select the optional soil climate which was defined in Step 02 of this tutorial:<br> | |||
[[Bild:Plus Example 20 BottomPlate05.png|Figure 1: Case 1|center|800px|Figure 20]] | [[Bild:Plus Example 20 BottomPlate05.png|Figure 1: Case 1|center|800px|Figure 20]] | ||
==Step 06: Defining the not-visualized components== | ==Step 06: Defining the not-visualized components== | ||
Besides the visualized components also not-visualized components can be added in a zone. These components are not shown in the “Visualization Box”, but they have an impact on the hygrothermal behavior of the building. In this example partition walls inside the zone are added as not-visualized components. | Besides the visualized components also not-visualized components can be added in a zone. These components are not shown in the “Visualization Box”, but they have an impact on the hygrothermal behavior of the building. In this example partition walls inside the zone are added as not-visualized components.<br> | ||
To add a new not-visualized component, open the “Not-visualized | To add a new not-visualized component, open the “Not-visualized components”-dialog (1) in “Project Tree” and click on the “New”-button (2). This creates a new entry in the list. Name it (3), check its type (4) and enter the area (5) of the partition walls, which is 25.2 m² in this example. Remember to use the outer dimensions when calculating the area of not-visualized components.<br> | ||
[[Bild:Plus Example 21 NotVisCompo01.png |Figure 1: Case 1|center|800|Figure 21]]After that the assembly of the partition walls has to be defined. Select the newly created not-visualized component in the “Project Tree” and proceed the same way as with visualized components. Again, a custom assembly has to be created. Its construction is summarized in the following table, starting from outside to inside: | [[Bild:Plus Example 21 NotVisCompo01.png |Figure 1: Case 1|center|800|Figure 21]]<br> | ||
After that the assembly of the partition walls has to be defined. Select the newly created not-visualized component in the “Project Tree” and proceed the same way as with visualized components. Again, a custom assembly has to be created. Its construction is summarized in the following table, starting from outside to inside:<br> | |||
{| | {| | ||
|'''Nr.''' | |'''Nr.''' | ||
| Zeile 147: | Zeile 153: | ||
|} | |} | ||
In the end, the assembly should look like this: | In the end, the assembly should look like this:<br> | ||
[[Bild: Plus Example 22 NotVisCompo02.png|Figure 1: Case 1|center|800px|Figure 22]]Further settings are not necessary for this component. | [[Bild: Plus Example 22 NotVisCompo02.png|Figure 1: Case 1|center|800px|Figure 22]]<br> | ||
Further settings are not necessary for this component. | |||
==Step 07: Setting internal loads and occupancy schedule== | ==Step 07: Setting internal loads and occupancy schedule== | ||
After all inputs concerning the zones geometry and its components are | After all inputs concerning the zones geometry and its components are complete, the usage of the zone should be described. This is done by defining internal loads, coming for example from human activity or electronic devices. WUFI® Plus uses internal heat-, moisture- and CO2-sources. Their amount and duration is defined in the “Internal Loads/ Occupancy”-dialog in the “Project Tree” through periodic day-profiles: Utilization profiles are assigned to custom periods which are defined by date and day. Each period is connected to a day-profile that describes a usage which is repeated for every day in this period. By combining multiple periods and day-profiles complex schedules can be created.<br> | ||
In this example, two usage situations will be defined: | In this example, two usage situations will be defined: | ||
* Weekend: No internal loads occur during the weekend. | * Weekend: No internal loads occur during the weekend. | ||
* Working days: Three adults are working from 8 am to 5 pm in an office job. During the remaining hours of the day no internal loads occur. | * Working days: Three adults are working from 8 am to 5 pm in an office job. During the remaining hours of the day no internal loads occur.<br> | ||
To include these profiles open the “Internal Loads/ Occupancy”-dialog in the “Project Tree”: | To include these profiles open the “Internal Loads/ Occupancy”-dialog in the “Project Tree”:<br> | ||
[[Bild:Plus Example 23 IntLoads01.png|Figure 1: Case 1|center|800px|Figure 23]]By default, a profile with zero internal loads is defined throughout the simula-tion time. As no internal loads occur during the weekend, we can use this de-fault profile for our weekend situation without entering further data. | [[Bild:Plus Example 23 IntLoads01.png|Figure 1: Case 1|center|800px|Figure 23]]<br> | ||
Now we have to define a profile for the working days. Add a new period by clicking the “New”-button (1). Make sure that the begin and end date are within the simulation time (2). As this profile is only valid for the working days, exclude Saturday and Sunday (3) as in the figure below: | By default, a profile with zero internal loads is defined throughout the simula-tion time. As no internal loads occur during the weekend, we can use this de-fault profile for our weekend situation without entering further data.<br> | ||
Now we have to define a profile for the working days. Add a new period by clicking the “New”-button (1). Make sure that the begin and end date are within the simulation time (2). As this profile is only valid for the working days, exclude Saturday and Sunday (3) as in the figure below:<br> | |||
[[Bild:Plus Example 24 IntLoads02.png |Figure 1: Case 1|center|800px|Figure 24]] | [[Bild:Plus Example 24 IntLoads02.png |Figure 1: Case 1|center|800px|Figure 24]]<br> | ||
WUFI® Plus prioritizes the different periods depending on their entry in the list: Higher numbers (1st column) have a higher priority than lower numbers in case they cover the same time period. This means in our example, that the profile for the working days has a higher priority than the default profile. Its day-profile is used instead of the one of the default profile. | <pre> WUFI® Plus prioritizes the different periods depending on their entry in the list: | ||
Higher numbers (1st column) have a higher priority than lower numbers in case they cover the same time period. | |||
Now, the day-profile for the working days has to be defined as in the figure below. First, the day-profile has to be defined by hours. Include new lines with the “New”-button (1). In this example three lines are necessary. Values for the internal loads can either be entered directly or the “Internal Loads Calculator” can be used. In this example, we do the latter. Select the line where internal loads occur (2nd line in this example) and click the “Calculator”-button (2) which opens the “Internal loads calculator”. Click the button in the “Specification” column (3) to open the internal loads database and search for “Adult, sitting person, working”. As three people are working in this zone raise the person counter to three (4). Confirm the calculation with the “OK”-button and it is included in the day-profile. | This means in our example, that the profile for the working days has a higher priority than the default profile. | ||
Its day-profile is used instead of the one of the default profile. | |||
</pre> | |||
<br> | |||
Now, the day-profile for the working days has to be defined as in the figure below. First, the day-profile has to be defined by hours. Include new lines with the “New”-button (1). In this example three lines are necessary. Values for the internal loads can either be entered directly or the “Internal Loads Calculator” can be used. In this example, we do the latter. Select the line where internal loads occur (2nd line in this example) and click the “Calculator”-button (2) which opens the “Internal loads calculator”. Click the button in the “Specification” column (3) to open the internal loads database and search for “Adult, sitting person, working”. As three people are working in this zone raise the person counter to three (4). Confirm the calculation with the “OK”-button and it is included in the day-profile. <br> | |||
[[Bild: Plus Example 25 IntLoads03.png|Figure 1: Case 1|center|800px|Figure 25]] | [[Bild: Plus Example 25 IntLoads03.png|Figure 1: Case 1|center|800px|Figure 25]]<br> | ||
Now, both usage situations are defined.<br> | Now, both usage situations are defined.<br> | ||
WUFI® Plus also comes with a large variety of predefined day-profiles for different occupancy and usage situations. These depend on well-known standards like for example DIN 18599-100 or DIN EN ISO 13790. | <pre> WUFI® Plus also comes with a large variety of predefined day-profiles for different occupancy and usage situations. | ||
The preset day-profiles can be selected by clicking on “Select from data-base” instead of “Calculator”. | These depend on well-known standards like for example DIN 18599-100 or DIN EN ISO 13790. | ||
The preset day-profiles can be selected by clicking on “Select from data-base” instead of “Calculator”. | |||
</pre> | |||
==Step 08: Defining design conditions== | |||
In the “Design conditions” setpoints for temperature, relative humidity and CO2-concentration are defined. The HVAC-system will maintain these setpoints as long as it’s capable of it. So, the settings in the “Design conditions”-dialog are strongly connected to the HVAC-settings, which will be defined in Step 11 of this tutorial. Also, they should be adjusted to the usage of the building or zone, which was defined in Step 07.<br> | |||
In this example only temperature will be controlled through a heating and a cooling system. As long as the three adults are present (8am to 5pm), temperature setpoints are set to 21°C (Minimum) and 24°C (Maximum). In the remaining time this interval is set to a wider range of 17°C (Minimum) and 27°C (Maximum). The minimum-setpoints correspond to the heating system, which will be activated if the indoor temperature would fall below this setpoint. And the maximum-setpoints refer to the cooling system, which starts cooling if the setpoint would be exceeded. <br> | |||
Now it’s time to define these setpoints in WUFI® Plus. Select the “Design Con-ditions”-dialog in the “Project Tree”. As only temperature is controlled, input is only necessary in the “Temperature – Minimum”- and “Temperature – Maximum”-tabs. The setpoints are entered with the help of “Periodic day profiles”, the same way as in Step 07. So, proceed as before: Create a second period for the working days and enter the day-profile as describe above. Also adjust the value for the weekend-profile. Repeat these steps for the maximum-temperature. In the end, the profiles should look like this:<br> | |||
[[Bild: PlusExample26Design.png|Figure 1: Case 1|center|800px|Figure 26]]<br> | |||
When defining schedules for design conditions always remember to also include a HVAC-system that is capable of executing those setpoints. For example, if there is no heating device, the minimum temperature can’t be maintained. | When defining schedules for design conditions always remember to also include a HVAC-system that is capable of executing those setpoints. For example, if there is no heating device, the minimum temperature can’t be maintained. | ||
==Step 09: Creating ventilation profiles== | ==Step 09: Creating ventilation profiles== | ||
Now the ventilation needs to be defined. WUFI® Plus differs between three ventilation-types: | Now the ventilation needs to be defined. WUFI® Plus differs between three ventilation-types: | ||
| Zeile 184: | Zeile 201: | ||
* Interzone ventilation between simulated and attached zones. | * Interzone ventilation between simulated and attached zones. | ||
The example building uses a mechanical ventilation system. So, this has to be defined together with permanent air infiltration through building leakages. Interzone ventilation between the simulated zone and the attached attic is not considered in this example. | The example building uses a mechanical ventilation system. So, this has to be defined together with permanent air infiltration through building leakages. Interzone ventilation between the simulated zone and the attached attic is not considered in this example. | ||
At first, start with the air change through infiltration. Open the “Ventilation”-dialog by clicking the respective entry in the “Project Tree”. In the “Natural”-tab (1) the air change rate for permanent infiltration can be entered (2), which shall be 0.1 h-1 in this example. No other natural ventilation is considered, so make sure, that the day-profile is set to zero (3). | At first, start with the air change through infiltration. Open the “Ventilation”-dialog by clicking the respective entry in the “Project Tree”. In the “Natural”-tab (1) the air change rate for permanent infiltration can be entered (2), which shall be 0.1 h-1 in this example. No other natural ventilation is considered, so make sure, that the day-profile is set to zero (3).<br> | ||
[[Bild:Plus Example 27 Vent01.png|Figure 1: Case 1|center|800px|Figure 27]]Next, the operation schedule for mechanical ventilation is defined. Switch to the “Mechanical”-tab (1). The ventilation system should provide a minimum air change rate of 0.4 h-1 at any time except the working hours (8am to 5pm from Monday to Friday) where it increases to 0.8 h-1. Enter these values by using periodic day-profiles (2 & 3) the same way as described in Step 07 and Step 08. In the end, the operation schedule for mechanical ventilation should look like this: | [[Bild:Plus Example 27 Vent01.png|Figure 1: Case 1|center|800px|Figure 27]]<br> | ||
Next, the operation schedule for mechanical ventilation is defined. Switch to the “Mechanical”-tab (1). The ventilation system should provide a minimum air change rate of 0.4 h-1 at any time except the working hours (8am to 5pm from Monday to Friday) where it increases to 0.8 h-1. Enter these values by using periodic day-profiles (2 & 3) the same way as described in Step 07 and Step 08. In the end, the operation schedule for mechanical ventilation should look like this:<br> | |||
[[Bild: Plus Example 28 Vent02.png |Figure 1: Case 1|center|800px|Figure | [[Bild: Plus Example 28 Vent02.png |Figure 1: Case 1|center|800px|Figure 28]]<br> | ||
No input has to be made for interzone ventilation in this example. <br> | |||
<pre> Always remember to include a mechanical ventilation device in the HVAC-dialog and assign it to the | |||
desired zone when defining schedules for mechanical ventilation. Else, these schedule can’t be executed. | |||
</pre> | |||
==Step 10: Climatic conditions in attached zone== | ==Step 10: Climatic conditions in attached zone== | ||
The climatic conditions in attached zones can be defined as an optional climate or they can be set to the outdoor climate. In this example, the latter option will be used for the unheated attic. Open the “Attached zone 1: unheated attic” in the “Project Tree” and alter the settings as in the figure below: | The climatic conditions in attached zones can be defined as an optional climate or they can be set to the outdoor climate. In this example, the latter option will be used for the unheated attic. Open the “Attached zone 1: unheated attic” in the “Project Tree” and alter the settings as in the figure below:<br> | ||
[[Bild:Plus Example 29 Attached.png |Figure 1: Case 1|center|800px|Figure 29]] | [[Bild:Plus Example 29 Attached.png |Figure 1: Case 1|center|800px|Figure 29]]<br> | ||
==Step 11: Including HVAC== | ==Step 11: Including HVAC== | ||
Now, the HVAC-system is defined. The example building needs devices for heating, cooling and mechanical ventilation, so the setpoints defined in Step 08 and the mechanical ventilation of Step 09 can be supplied. | Now, the HVAC-system is defined. The example building needs devices for heating, cooling and mechanical ventilation, so the setpoints defined in Step 08 and the mechanical ventilation of Step 09 can be supplied. <br> | ||
Select the “HVAC”-dialog (1) in the “Project Tree” and create a new HVAC-system by clicking the “New”-button (2). In this example, a custom system is used, so select the system-type “User defined (idealized)” (3). | Select the “HVAC”-dialog (1) in the “Project Tree” and create a new HVAC-system by clicking the “New”-button (2). In this example, a custom system is used, so select the system-type “User defined (idealized)” (3).<br> | ||
[[Bild:Plus Example 30 HVAC01.png |Figure 1: Case 1|center|800px|Figure 30]] | [[Bild:Plus Example 30 HVAC01.png |Figure 1: Case 1|center|800px|Figure 30]]<br> | ||
The new HVAC-system appears now in the “Project Tree” (1). Select it and the “HVAC-System”-dialog opens where the system can be named (2) and its different HVAC-devices can be added. Click the “New”-button (3) to add a HVAC-device and check mark its usage-type in the table (4). In this example three different devices are necessary: One for space heating, one for space cooling and a mechanical ventilation. In the end, the input for the HVAC-devices looks like this: | The new HVAC-system appears now in the “Project Tree” (1). Select it and the “HVAC-System”-dialog opens where the system can be named (2) and its different HVAC-devices can be added. Click the “New”-button (3) to add a HVAC-device and check mark its usage-type in the table (4). In this example three different devices are necessary: One for space heating, one for space cooling and a mechanical ventilation. In the end, the input for the HVAC-devices looks like this:<br> | ||
[[Bild:Plus Example 31 HVAC02.png |Figure 1: Case 1|center|800px|Figure 31]] | [[Bild:Plus Example 31 HVAC02.png |Figure 1: Case 1|center|800px|Figure 31]]<br> | ||
Each device is now also listed in the “Project Tree” (1). It can be selected and its properties can be altered to these constant values in (2 & 3): | Each device is now also listed in the “Project Tree” (1). It can be selected and its properties can be altered to these constant values in (2 & 3): | ||
* Space heating capacity: 40 kW | * Space heating capacity: 40 kW | ||
| Zeile 210: | Zeile 230: | ||
* Ventilation capacity: 500 m³/h. Heat recovery rate of 60 %. | * Ventilation capacity: 500 m³/h. Heat recovery rate of 60 %. | ||
<br> | |||
[[Bild:Plus Example 32 HVAC03.png |Figure 1: Case 1|center|800px|Figure 32]] | [[Bild:Plus Example 32 HVAC03.png |Figure 1: Case 1|center|800px|Figure 32]] | ||
==Step 12: Filling missing data== | ==Step 12: Filling missing data== | ||
All necessary data should be entered by now. However, the “Status & Results Box” hints that some data is still missing. Double-clicking the “Status & Results Box” always guides you automatically to the source of the problem: Here, the net volume of the zone is still missing. Select the option “From gross volume and components” and WUFI® Plus calculates it automatically from the visual-ized geometry and the visualized components. However, this value should | All necessary data should be entered by now. However, the “Status & Results Box” hints that some data is still missing. Double-clicking the “Status & Results Box” always guides you automatically to the source of the problem: Here, the net volume of the zone is still missing. Select the option “From gross volume and components” and WUFI® Plus calculates it automatically from the visual-ized geometry and the visualized components. However, this value should always be checked by the user if it was calculated correctly, as it has a huge impact on the calculations.<br> | ||
[[Bild:Plus Example 33 Remaining.png |Figure 1: Case 1|center|800px|Figure 33]] | [[Bild:Plus Example 33 Remaining.png |Figure 1: Case 1|center|800px|Figure 33]] | ||
==Step 13: Simulation== | ==Step 13: Simulation== | ||
Now that really all necessary data is entered the “Status & Results Box” changes its appearance and the simulation can be started by clicking the “Start”-button: | Now that really all necessary data is entered the “Status & Results Box” changes its appearance and the simulation can be started by clicking the “Start”-button:<br> | ||
[[Bild: Plus Example 34 Sim01.png|Figure 1: Case 1|center|800px|Figure 34]] | [[Bild: Plus Example 34 Sim01.png|Figure 1: Case 1|center|800px|Figure 34]]<br> | ||
During a simulation the calculation process can be observed in many ways: | During a simulation the calculation process can be observed in many ways:<br> | ||
* A progress bar in the “Status & Results Box” shows the overall calcula-tion progress | * A progress bar in the “Status & Results Box” shows the overall calcula-tion progress | ||
* Selecting the “Case”-entry in the “Project Tree” gives a summary of the current calculation. | * Selecting the “Case”-entry in the “Project Tree” gives a summary of the current calculation. | ||
* Selecting a zone in the “Project Tree” shows graphs of current simula-tion results. | * Selecting a zone in the “Project Tree” shows graphs of current simula-tion results. | ||
* Selecting a component in the “Project Tree” shows the WUFI® Film with the temperature and humidity conditions inside the component. | * Selecting a component in the “Project Tree” shows the WUFI® Film with the temperature and humidity conditions inside the component. | ||
The visualizations during a simulation can be deactivated to increase calculation speed. To do this, click the “Maximum speed”-button in the “Status & Results Box”. | The visualizations during a simulation can be deactivated to increase calculation speed. To do this, click the “Maximum speed”-button in the “Status & Results Box”. <br> | ||
[[Bild: Plus Example 35 Sim02.png |Figure 1: Case 1|center|800px|Figure 35]] | [[Bild: Plus Example 35 Sim02.png |Figure 1: Case 1|center|800px|Figure 35]]<br> | ||
[[Bild: Plus Example 36 Sim03.png |Figure 1: Case 1|center|800px|Figure 36]]<br> | |||
[[Bild: Plus Example 37 Sim04.png |Figure 1: Case 1|center|800px|Figure 37]]<br> | |||
[[Bild: Plus Example 37 Sim04.png |Figure 1: Case 1|center|800px|Figure 37]] | |||
==Step 14: Assessing the results== | ==Step 14: Assessing the results== | ||
After the simulation is finished its results can be assessed in detail in WUFI® Plus. They can be exported to external applications, too. Also predefined | After the simulation is finished its results can be assessed in detail in WUFI® Plus. They can be exported to external applications, too. Also predefined reports can be viewed, printed and exported to Microsoft Word or Excel. Some exemplary evaluation methods are described below. Please refer also to chapter 9 of the manual, where all possibilities of working with WUFI® Plus results are described in more detail. <br> | ||
In this example results are available for the simulated zone and for each com-ponent. We will create a report and export it to Microsoft Office, view result graphs and export the calculation results as a text-file. | In this example results are available for the simulated zone and for each com-ponent. We will create a report and export it to Microsoft Office, view result graphs and export the calculation results as a text-file. <br> | ||
At first, a report with the general calculation results is viewed. Select the “Case”-dialog in the “Project Tree” and open the “Report: Data & results”-tab (1). Switch to different preset reports by changing the “Scope” (2). Select the “Results” report and have a look at the main results. All reports can be exported to Microsoft Excel and Word by clicking the respective buttons (3). To print a report change the view to “Print layout” (4) and click one of the “Print”-buttons (5). | At first, a report with the general calculation results is viewed. Select the “Case”-dialog in the “Project Tree” and open the “Report: Data & results”-tab (1). Switch to different preset reports by changing the “Scope” (2). Select the “Results” report and have a look at the main results. All reports can be exported to Microsoft Excel and Word by clicking the respective buttons (3). To print a report change the view to “Print layout” (4) and click one of the “Print”-buttons (5).<br> | ||
[[Bild:Plus Example 38 Results01.png |Figure 1: Case 1|center|800px|Figure 38]] | [[Bild:Plus Example 38 Results01.png |Figure 1: Case 1|center|800px|Figure 38]]<br> | ||
Next, graphs with the calculated hourly results are viewed. Switch to the “Graphs”-tab (1). Here, different preset graphs can be selected (2). Please have a detailed look at the simulation results and view the different graphs. The graphs can also be printed by changing the view to the print layout (3) and clicking one of the “Print”-buttons (4). With the “Copy to clipboard”-button (5) the active graph is copied and can be inserted in any other application. | Next, graphs with the calculated hourly results are viewed. Switch to the “Graphs”-tab (1). Here, different preset graphs can be selected (2). Please have a detailed look at the simulation results and view the different graphs. The graphs can also be printed by changing the view to the print layout (3) and clicking one of the “Print”-buttons (4). With the “Copy to clipboard”-button (5) the active graph is copied and can be inserted in any other application. <br> | ||
[[Bild:Plus Example 39 Results02.png |Figure 1: Case 1|center|800px|Figure 39]] | [[Bild:Plus Example 39 Results02.png |Figure 1: Case 1|center|800px|Figure 39]]<br> | ||
The results can also be exported to Microsoft Excel or as a text-file. These are powerful options to evaluate the calculated results as it enables the user to use external analysis programs. To export the calculation results switch to the “Export”-tab (1). The table (2) lists all available results that can be exported. Select multiple lines by clicking on them while pressing the “Ctrl”-key. These blue marked lines will be exported. Also an option exists which selects all available calculation results including results of components (3). To export the results to an external text-file, a save-path has to be created first (4). Afterwards, the results can be exported to this file by clicking the “Export to file”-button (5). The selected results can also be exported to Microsoft Excel by clicking the respective button (6). For this option no save path has to be defined and Excel starts automatically with the exported results. | The results can also be exported to Microsoft Excel or as a text-file. These are powerful options to evaluate the calculated results as it enables the user to use external analysis programs. To export the calculation results switch to the “Export”-tab (1). The table (2) lists all available results that can be exported. Select multiple lines by clicking on them while pressing the “Ctrl”-key. These blue marked lines will be exported. Also an option exists which selects all available calculation results including results of components (3). To export the results to an external text-file, a save-path has to be created first (4). Afterwards, the results can be exported to this file by clicking the “Export to file”-button (5). The selected results can also be exported to Microsoft Excel by clicking the respective button (6). For this option no save path has to be defined and Excel starts automatically with the exported results.<br> | ||
[[Bild:Plus Example 40 Results03.png |Figure 1: Case 1|center|800px|Figure 40]] | [[Bild:Plus Example 40 Results03.png |Figure 1: Case 1|center|800px|Figure 40]]<br> | ||
As the “Retain calculation results”-option was activated in Step 05 for all components, their results can now be viewed. Also the WUFI® Film is saved for each component. To view the results of a component select it in the “Project Tree” and switch to the “Report: Data & results”-tab. There reports, graphs and the WUFI® Film of the component can be found in the respective tabs. The results can also be exported in the “Export”-tab. Now let’s have a look at the WUFI® Film of the exterior wall oriented in south-west direction. Select the respective component (1) and open the “Film”-tab in the “Report”-section (2). The dropdown-menu above the film allows switching through different grouped components (3). Select the south-western wall. This can also be done by clicking on the component in the “Visualization Box”. Now the film can be watched (4), exported as a movie-file in the .avi-format (5) or exported to the “Extended animation”-tool (6) that is shipped with WUFI® Plus. This external tool is an even more detailed assessment option for component results and serves as a bridge for postprocessors like for example WUFI® Bio, which allows the evaluation of mold growth risks on surfaces. Please refer to chapter 9.4 for further information about the capabilities of this tool. | As the “Retain calculation results”-option was activated in Step 05 for all components, their results can now be viewed. Also the WUFI® Film is saved for each component. To view the results of a component select it in the “Project Tree” and switch to the “Report: Data & results”-tab. There reports, graphs and the WUFI® Film of the component can be found in the respective tabs. The results can also be exported in the “Export”-tab. Now let’s have a look at the WUFI® Film of the exterior wall oriented in south-west direction. Select the respective component (1) and open the “Film”-tab in the “Report”-section (2). The dropdown-menu above the film allows switching through different grouped components (3). Select the south-western wall. This can also be done by clicking on the component in the “Visualization Box”. Now the film can be watched (4), exported as a movie-file in the .avi-format (5) or exported to the “Extended animation”-tool (6) that is shipped with WUFI® Plus. This external tool is an even more detailed assessment option for component results and serves as a bridge for postprocessors like for example WUFI® Bio, which allows the evaluation of mold growth risks on surfaces. Please refer to chapter 9.4 for further information about the capabilities of this tool. | ||
Aktuelle Version vom 29. Oktober 2018, 09:30 Uhr
This short example shows you step by step how to input and calculate a case in WUFI® Plus. There is also a movie demonstrating all the steps.
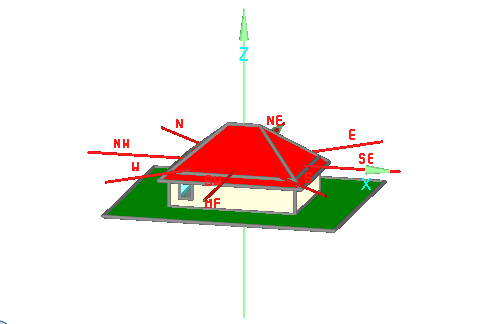
Additional information:
- Footprint: 12.0 m x 9.0 m
- 1 story, height 2.8 m, slab on ground
- roof inclination 40°, hipped roof
- Used as an office building. Occupied from Monday until Friday from 8 am to 5 pm with 3 persons. No usage on weekends.
- Heating & Cooling systems
- Mechanical Ventilation
- Located in Holzkirchen, Germany
Step 01: Creating a new project
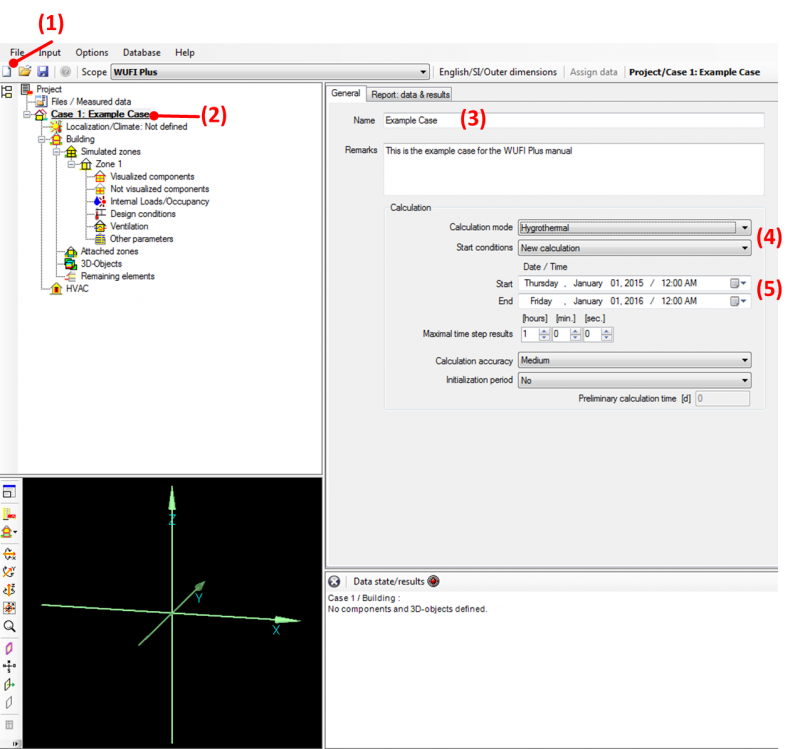
Start a new project by clicking the “New project”-button (1). Then open the “Case”-dialog (2) and enter general settings for the simulation: Give a significant name (3) and adjust the start and end date for the calculation (5) so that the simulation time is one year. In this example we use the hygrothermal calculation mode, make sure that this option is set (4).
Step 02: Defining climatic conditions
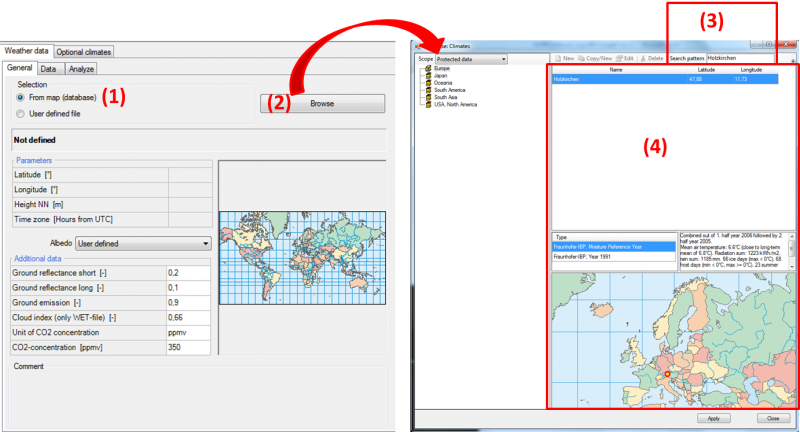
In the second step we adjust the outdoor climatic conditions in the “Localization/ Climate”-dialog. In this example we use a climate file from the WUFI® Database, which can be opened by selecting “From map (database)” (1) and then clicking the “Browse”-button (2). In the “Database”-Window select the “Moisture Reference Year” for the location “Holzkirchen” in Europe (4). The database can easily be searched by name with the “Search pattern” (3).
After the outdoor climate was selected a summary of temperature, moisture, radiation and rain can be seen in the “Data” and “Analyze”-tab.

Furthermore an optional climate has to be defined which represents the soil climate in this example. It will be applied to all components in contact with the ground. An optional climate can be defined in the “Optional Climates”-tab (1) by clicking the “New”-button (2). Now its type has to be selected (3). Sine curves are a good way to describe the soil climate, so we use this type and give it an appropriate name (4).
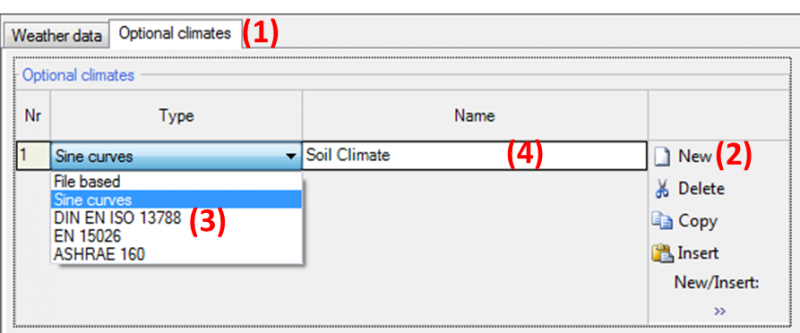
As none of the preset sine curves represent soil climate, we define a “User defined sine curve” (1) and enter these values (2):
- Temperature: sine curve; mean value 6 °C; amplitude 5.5 K; day of maximum 16th of August.
- Relative Humidity: constant; mean value 99 % RH.
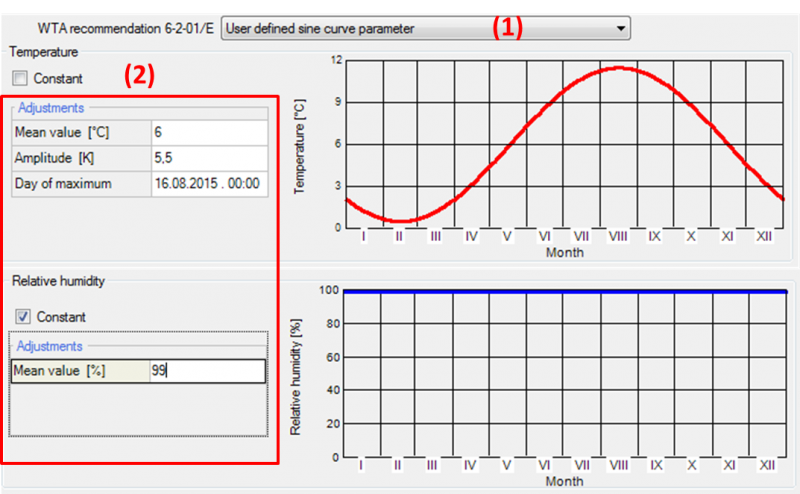
Please note that the values entered in this dialog depend strongly on your selected location and therefore should not be used in other projects.
Step 03: Creating building geometry
In this example we use the “Building Wizard” to create the geometry of our building. This is one of multiple options to enter a building geometry into WU-FI® Plus, please refer to chapter 4.5.1 for further information about the other ones.
Start the “Building Wizard” by clicking on the respective button in the “Build-ing”-dialog. The example building has a rectangular footprint, an unheated attic and a slab on ground. The orientation of the main-facade is south-west. This information can be entered into the “Building Wizard” together with the associated measurements:
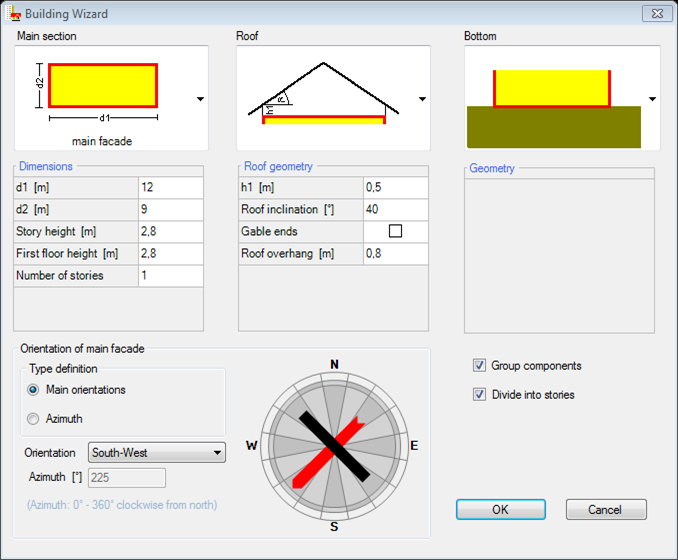
Close the “Building Wizard” with the “OK”-button and the geometry of the building is created automatically: All zones and components are generated according to the input in the “Building Wizard” and can be selected in the “Project Tree”. Also, a 3D-visualization is shown in the “Visualization Box”.
No advanced calculation options will be used in this example. So no user input is necessary in the “Numerics”-tab of the “Building”-dialog. Only the checkbox for “Include shading calculation” should be check marked.
Step 04: Including a window
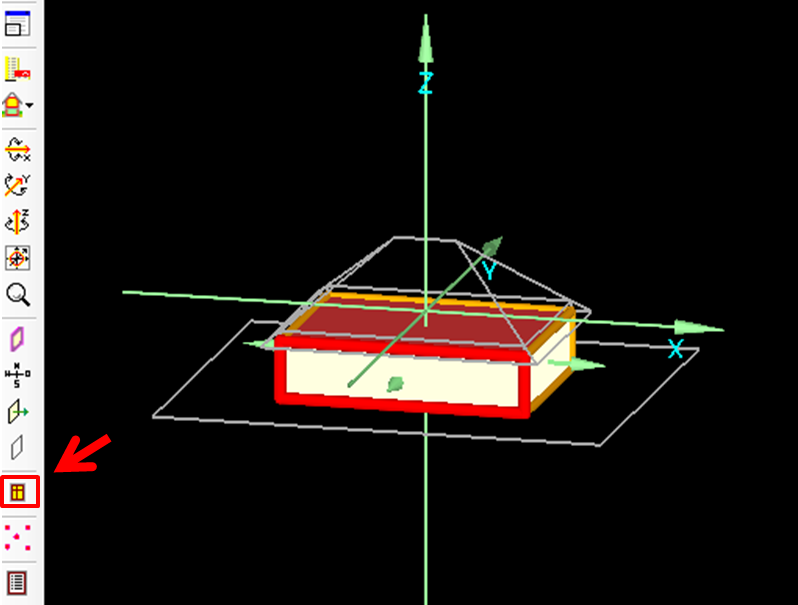
In this step a window is included into the south-western wall of the example building. To create a window select the respective wall in the “Visualization Box”, check its normal vector as described in chapter 3.4.2 and then click the “Windows/ Openings”-button:
The “Component openings”-dialog opens. First, check the direction of the view on the component (1), to ensure that the entered window appears in the desired place. The view-direction can be switched with the “Change View”-button (3). In this example, we use the view from outside. Next, click the “New”-button (2) to add the type (4), position (5) and size (6) of the window in this wall. Confirm your input with the “OK”-button and the new window is inserted in the wall and appears both in visualization and the “Project Tree”.
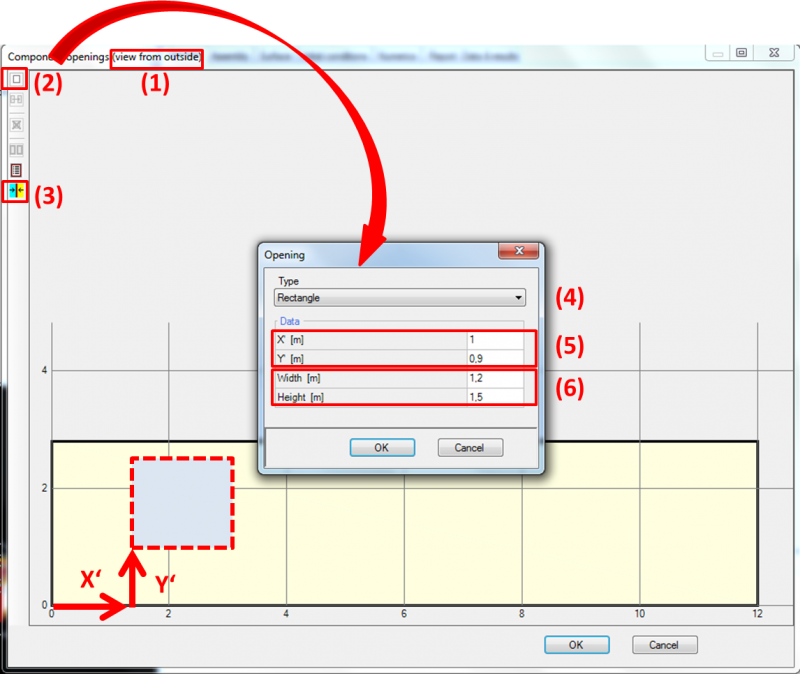
No other windows are included in this simple example.
Step 05: Defining the visualized components
The example building consists of four visualized components that surround the simulated zone: Floor slab, ceiling, exterior wall and the window. In this step we define the assemblies and additional parameters of these four components.
Exterior Walls
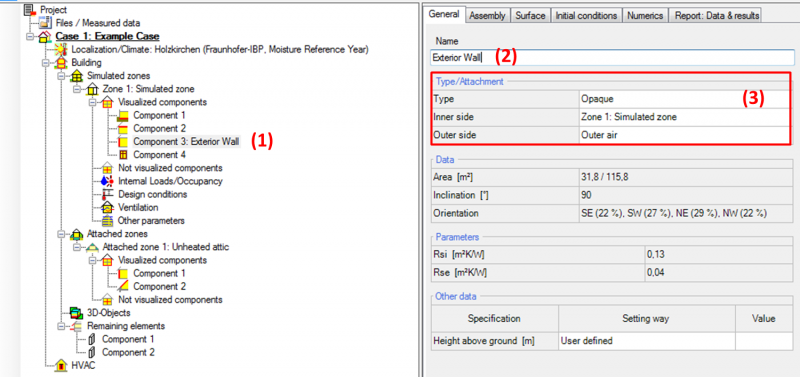
We start with the exterior walls. Select the component in the “Project Tree” (1) and its general information is shown. Enter a significant name (2) and check if the type and attachments on the inner and outer sides (3) are correct. The name of the component appears also in the “Project Tree” to facilitate navigation in the project.
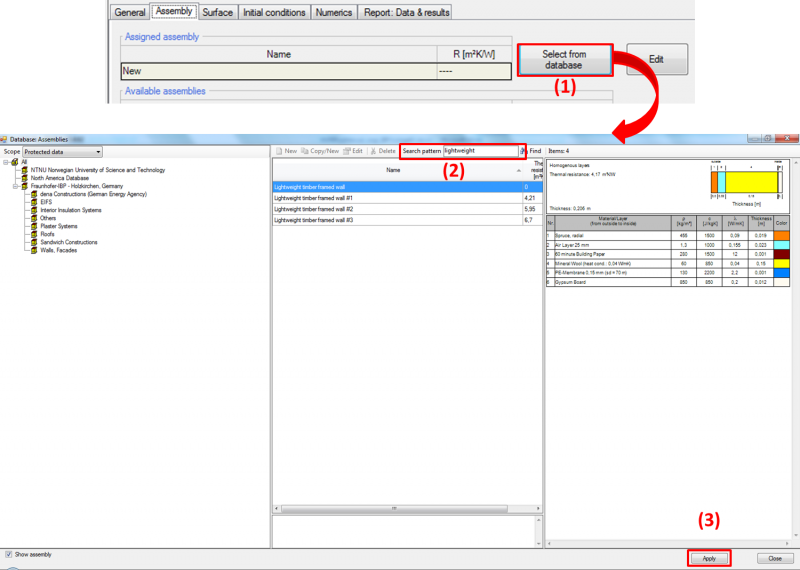
Next, the assembly of the component has to be defined, so switch to the “As-sembly”-tab. For this example, we use a predefined assembly from the WUFI® Plus Database, a lightweight timber framed wall. Click “Select from Database” (1) and the Database opens. Use the “Search pattern” (2) to find the desired assembly (“Lightweight timber framed wall”), as shown in the figure below. By clicking the “Apply”-button (3) the selected assembly from the database is applied to the exterior walls of our example.
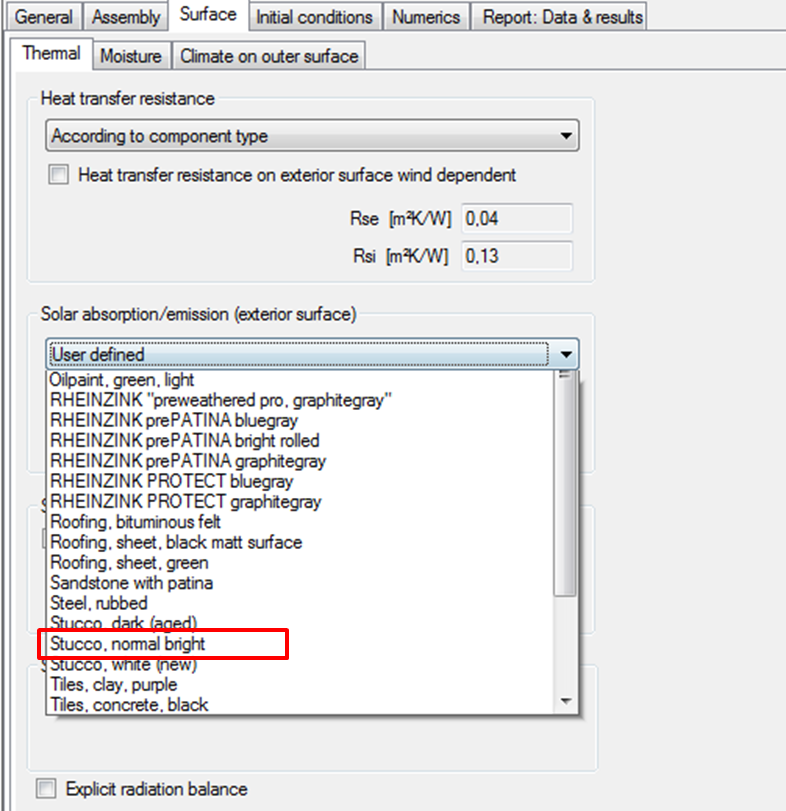
Settings for the hygrothermal conditions on the components surfaces can be defined in the “Surface”-tab. On the “Thermal” side we adjust the solar ab-sorption and emission coefficients for the exterior surface and select predefined values for “Stucco, normal bright”:
For this component, the surface conditions for “Moisture” and “Climate on outer surface” remain unchanged. Also, settings for the “Initial Conditions” and special calculation options in the “Numerics”-tab stay with their preset standard values.
In the “Report: Data & results”-tab the option “Retain calculation results” is check marked. Now WUFI® Plus saves all calculation results for this component and they can be evaluated after the simulation.
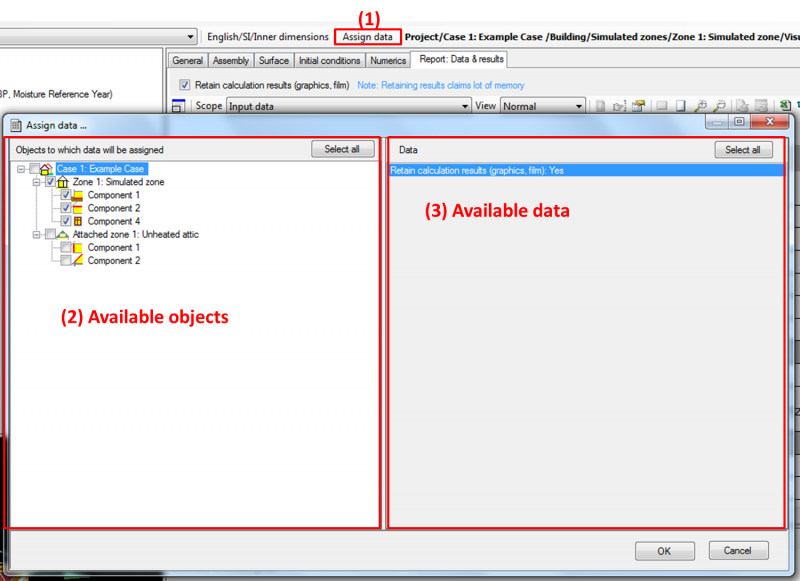
As we want to retain the calculation results for all other components of the simulated zone, too, we use the “Assign data”-function to set this option for them. This function saves time, as it allows setting certain parameters for a selection of other components automatically. Click the “Assign data”-button (1) in the “Tool Bar” and the “Assign data”-window opens as in the figure below. On the right side (3), all parameters are listed that can be assigned to other components, in this case, only “Retain calculation results” is listed. On the left side (2), all available components are listed. Select all components of the simulated zone, then click the “OK”-button and confirm in the next dialog, that the existing settings of the other components will be overwritten. Now, the calculation results of all components will be retained after the simulation.
The settings for the exterior wall are complete. Proceed with the next component.
Ceiling
The next assembly is the ceiling. We proceed in the same way as for the exterior wall: Name the component, check the type and the inner and outer attachments.
Again, use an assembly from the database. Search for “Flat Roof#1” and assign this assembly:
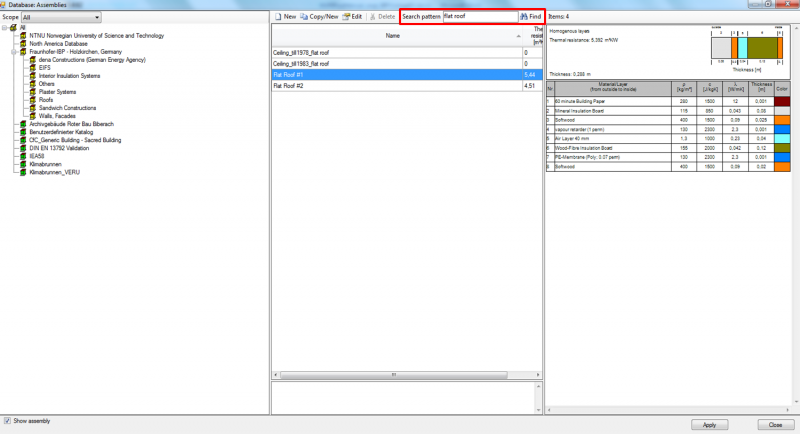
All other settings for this component remain at their default values. As the “Assign data”-function was used before, the calculation results for the ceiling will be retained.
Window
For the window we proceed as before: First, naming and checking the data in the “General”-tab. Then select a window type from the database, which works the same as with the assemblies described before. Search for “Uncoated double glazing” and apply the window:
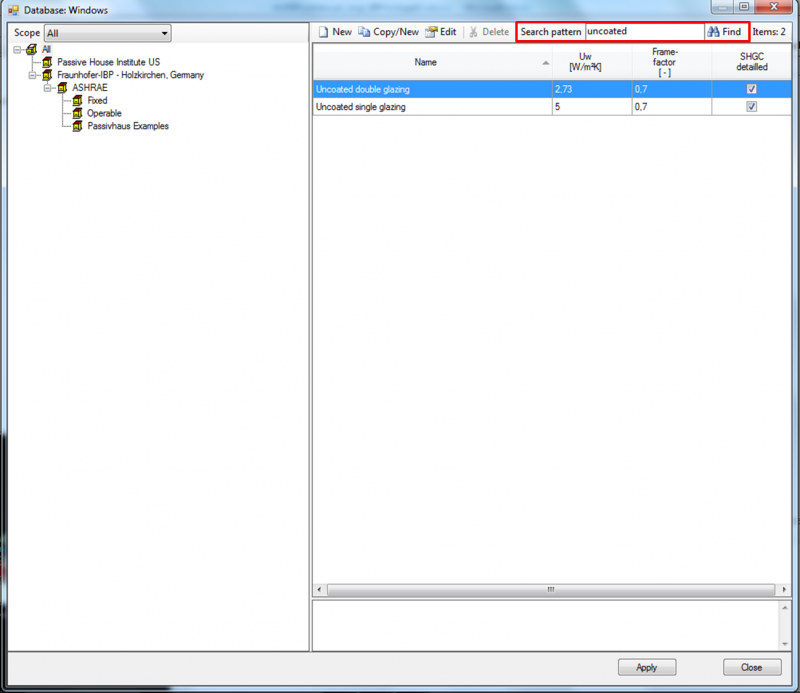
Window parameters can be altered by clicking the “Edit”-button in the “Window parameters”-tab. However, in this example the settings from the database remain unchanged. Also no settings are made in the “Surface”-tab and no solar protection is added.
Floor Slab
The last component is the floor slab. Name it and check the settings in the “General”-tab. This time no assembly from the database is used hence a new one has to be defined. Click the “Edit”-button in the “Assembly”-tab and the “Edit assembly”-window opens:
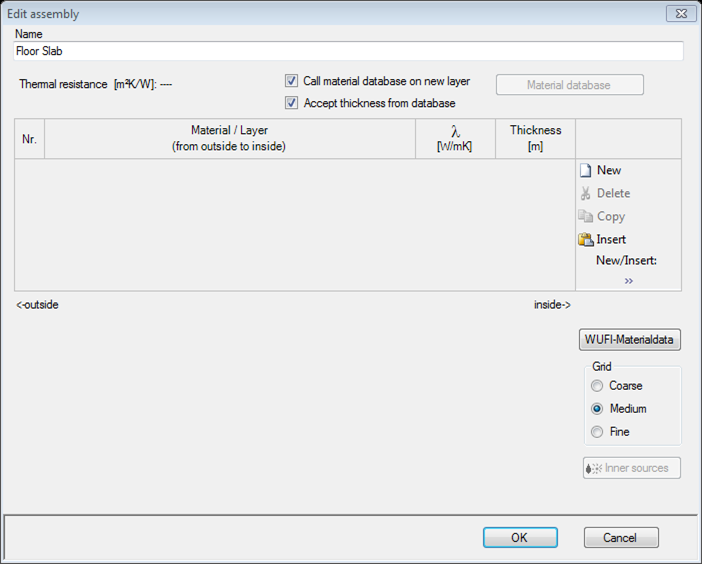
At first, name the assembly, in this case “Floor Slab” (1). Each assembly is built from different material layers. The construction of the exemplary floor slab is summarized in this table, starting from outside to inside:
| Nr. | Material (as named in WUFI® Plus Database) | Thickness [m] |
| 1 | XPS Surface Skin (heat cond.: 0,03 W/mK) | 0,010 |
| 2 | XPS Core (heat cond.: 0,03 W/mK) | 0,220 |
| 3 | XPS Surface Skin (heat cond.: 0,03 W/mK) | 0,010 |
| 4 | PE-Membrane 0,2 mm (sd = 87 m) | 0,001 |
| 5 | Concrete, w/c=0,5 | 0,200 |
Click the “New”-button (2) to add a new material layer. The “Material Data-base” will open. Search for “XPS Surface Skin” and add this material to the assembly by clicking the “Apply”-button:
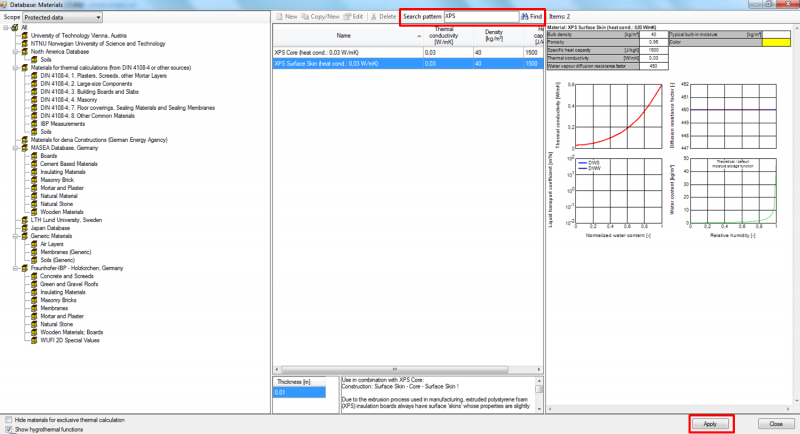
The material appears now in the “Edit assembly”-window. Check, if the thickness is entered correctly and alter it, if necessary:
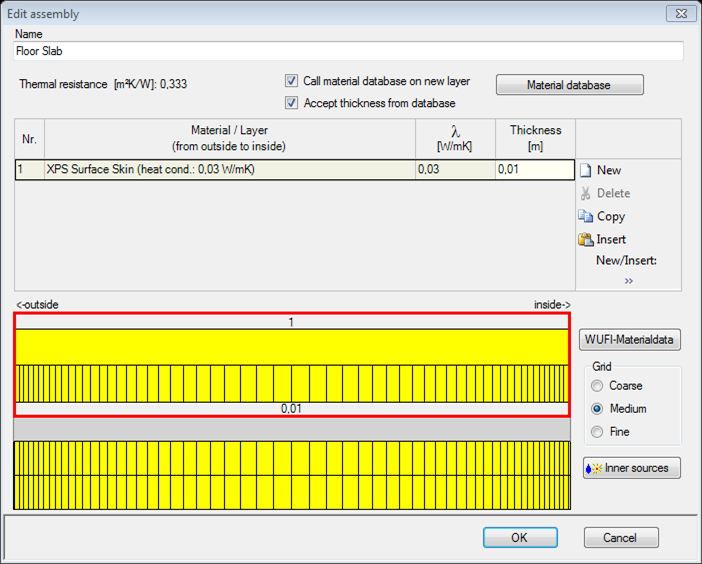
Proceed like this and add all other material layers. When finished, the assembly should look like this:
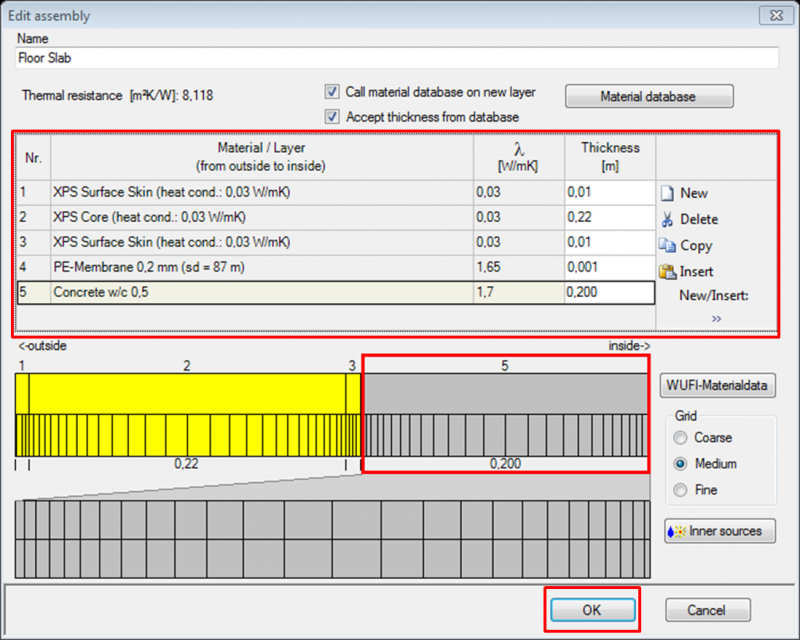
Click the “OK”-button and the assembly is assigned to the component.
As the floor slab is attached to the ground on its exterior side, the climate on the exterior surface of the component has to be defined separately. This can be done in the “Surface”-tab under “Climate on outer surface”. Click on the dropdown-menu besides “Optional Climate” and select the optional soil climate which was defined in Step 02 of this tutorial:

Step 06: Defining the not-visualized components
Besides the visualized components also not-visualized components can be added in a zone. These components are not shown in the “Visualization Box”, but they have an impact on the hygrothermal behavior of the building. In this example partition walls inside the zone are added as not-visualized components.
To add a new not-visualized component, open the “Not-visualized components”-dialog (1) in “Project Tree” and click on the “New”-button (2). This creates a new entry in the list. Name it (3), check its type (4) and enter the area (5) of the partition walls, which is 25.2 m² in this example. Remember to use the outer dimensions when calculating the area of not-visualized components.

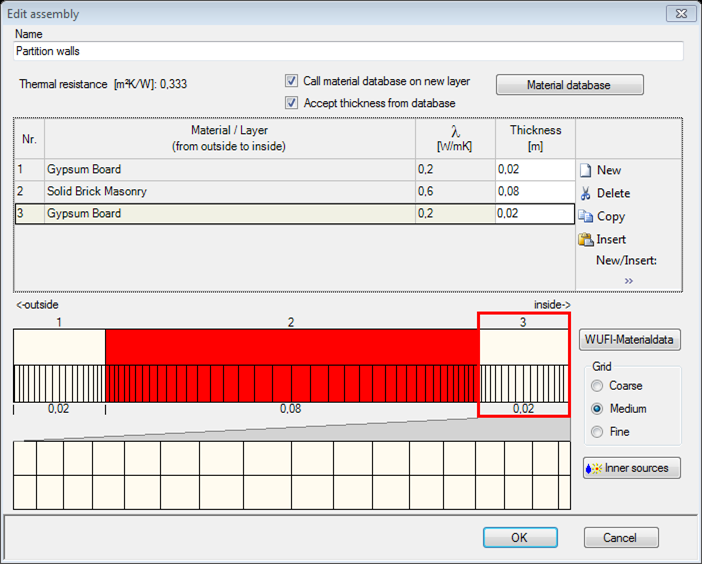
After that the assembly of the partition walls has to be defined. Select the newly created not-visualized component in the “Project Tree” and proceed the same way as with visualized components. Again, a custom assembly has to be created. Its construction is summarized in the following table, starting from outside to inside:
| Nr. | Material (as named in WUFI® Plus Database) | Thickness [m] |
| 1 | Gypsum Board | 0,020 |
| 2 | Solid Brick Masonry | 0,080 |
| 3 | Gypsum Board | 0,020 |
In the end, the assembly should look like this:
Further settings are not necessary for this component.
Step 07: Setting internal loads and occupancy schedule
After all inputs concerning the zones geometry and its components are complete, the usage of the zone should be described. This is done by defining internal loads, coming for example from human activity or electronic devices. WUFI® Plus uses internal heat-, moisture- and CO2-sources. Their amount and duration is defined in the “Internal Loads/ Occupancy”-dialog in the “Project Tree” through periodic day-profiles: Utilization profiles are assigned to custom periods which are defined by date and day. Each period is connected to a day-profile that describes a usage which is repeated for every day in this period. By combining multiple periods and day-profiles complex schedules can be created.
In this example, two usage situations will be defined:
- Weekend: No internal loads occur during the weekend.
- Working days: Three adults are working from 8 am to 5 pm in an office job. During the remaining hours of the day no internal loads occur.
To include these profiles open the “Internal Loads/ Occupancy”-dialog in the “Project Tree”:
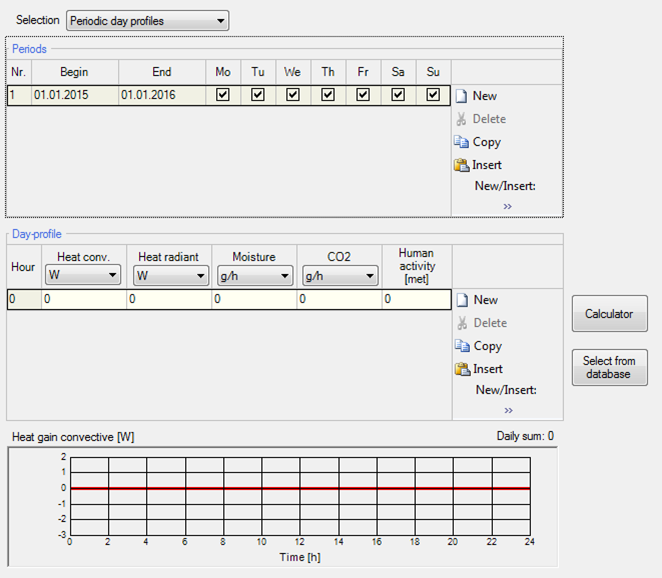
By default, a profile with zero internal loads is defined throughout the simula-tion time. As no internal loads occur during the weekend, we can use this de-fault profile for our weekend situation without entering further data.
Now we have to define a profile for the working days. Add a new period by clicking the “New”-button (1). Make sure that the begin and end date are within the simulation time (2). As this profile is only valid for the working days, exclude Saturday and Sunday (3) as in the figure below:
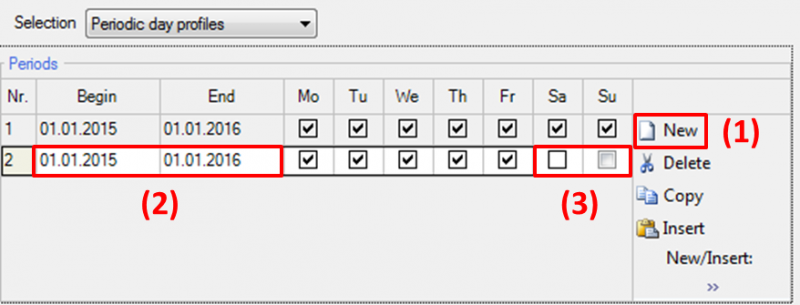
WUFI® Plus prioritizes the different periods depending on their entry in the list: Higher numbers (1st column) have a higher priority than lower numbers in case they cover the same time period. This means in our example, that the profile for the working days has a higher priority than the default profile. Its day-profile is used instead of the one of the default profile.
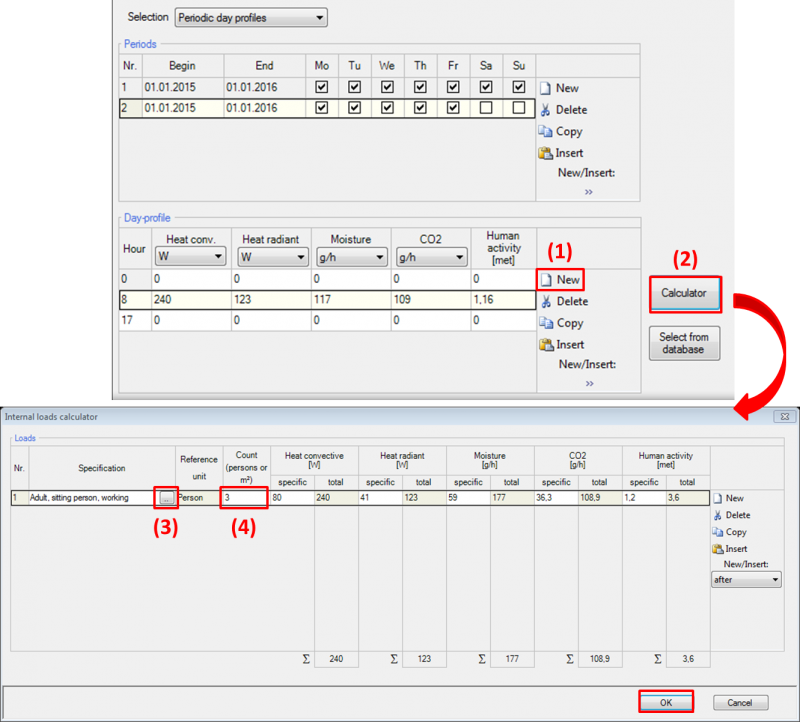
Now, the day-profile for the working days has to be defined as in the figure below. First, the day-profile has to be defined by hours. Include new lines with the “New”-button (1). In this example three lines are necessary. Values for the internal loads can either be entered directly or the “Internal Loads Calculator” can be used. In this example, we do the latter. Select the line where internal loads occur (2nd line in this example) and click the “Calculator”-button (2) which opens the “Internal loads calculator”. Click the button in the “Specification” column (3) to open the internal loads database and search for “Adult, sitting person, working”. As three people are working in this zone raise the person counter to three (4). Confirm the calculation with the “OK”-button and it is included in the day-profile.
Now, both usage situations are defined.
	WUFI® Plus also comes with a large variety of predefined day-profiles for different occupancy and usage situations.
	These depend on well-known standards like for example DIN 18599-100 or DIN EN ISO 13790.
	The preset day-profiles can be selected by clicking on “Select from data-base” instead of “Calculator”.
Step 08: Defining design conditions
In the “Design conditions” setpoints for temperature, relative humidity and CO2-concentration are defined. The HVAC-system will maintain these setpoints as long as it’s capable of it. So, the settings in the “Design conditions”-dialog are strongly connected to the HVAC-settings, which will be defined in Step 11 of this tutorial. Also, they should be adjusted to the usage of the building or zone, which was defined in Step 07.
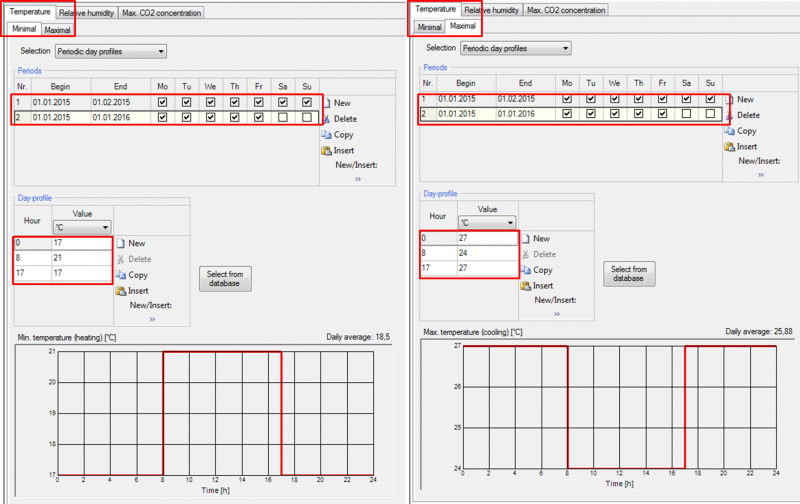
In this example only temperature will be controlled through a heating and a cooling system. As long as the three adults are present (8am to 5pm), temperature setpoints are set to 21°C (Minimum) and 24°C (Maximum). In the remaining time this interval is set to a wider range of 17°C (Minimum) and 27°C (Maximum). The minimum-setpoints correspond to the heating system, which will be activated if the indoor temperature would fall below this setpoint. And the maximum-setpoints refer to the cooling system, which starts cooling if the setpoint would be exceeded.
Now it’s time to define these setpoints in WUFI® Plus. Select the “Design Con-ditions”-dialog in the “Project Tree”. As only temperature is controlled, input is only necessary in the “Temperature – Minimum”- and “Temperature – Maximum”-tabs. The setpoints are entered with the help of “Periodic day profiles”, the same way as in Step 07. So, proceed as before: Create a second period for the working days and enter the day-profile as describe above. Also adjust the value for the weekend-profile. Repeat these steps for the maximum-temperature. In the end, the profiles should look like this:
When defining schedules for design conditions always remember to also include a HVAC-system that is capable of executing those setpoints. For example, if there is no heating device, the minimum temperature can’t be maintained.
Step 09: Creating ventilation profiles
Now the ventilation needs to be defined. WUFI® Plus differs between three ventilation-types:
- Natural ventilation includes the air infiltration through building leakages and window openings.
- Mechanical ventilation systems.
- Interzone ventilation between simulated and attached zones.
The example building uses a mechanical ventilation system. So, this has to be defined together with permanent air infiltration through building leakages. Interzone ventilation between the simulated zone and the attached attic is not considered in this example.
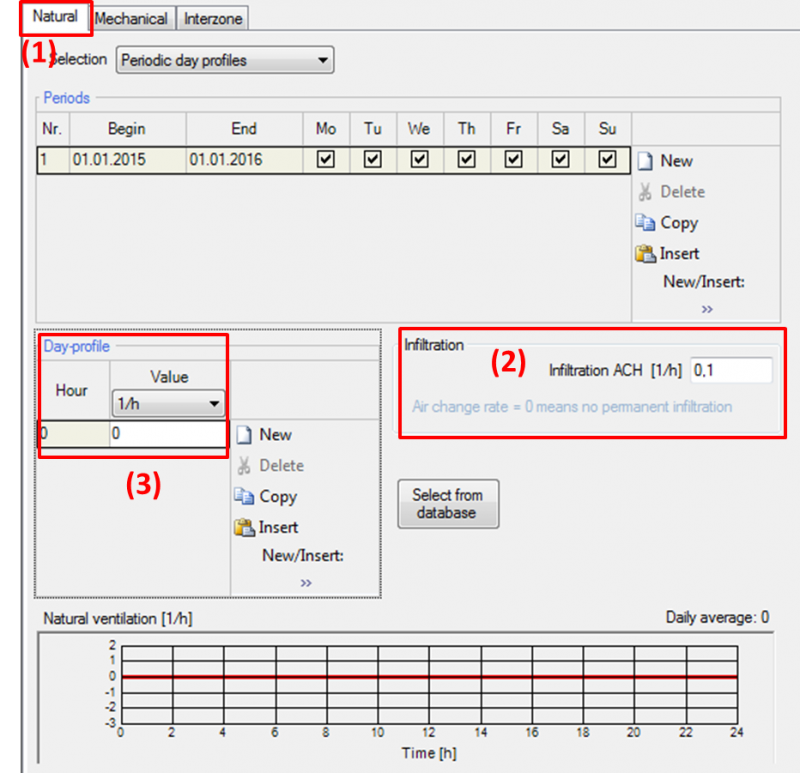
At first, start with the air change through infiltration. Open the “Ventilation”-dialog by clicking the respective entry in the “Project Tree”. In the “Natural”-tab (1) the air change rate for permanent infiltration can be entered (2), which shall be 0.1 h-1 in this example. No other natural ventilation is considered, so make sure, that the day-profile is set to zero (3).
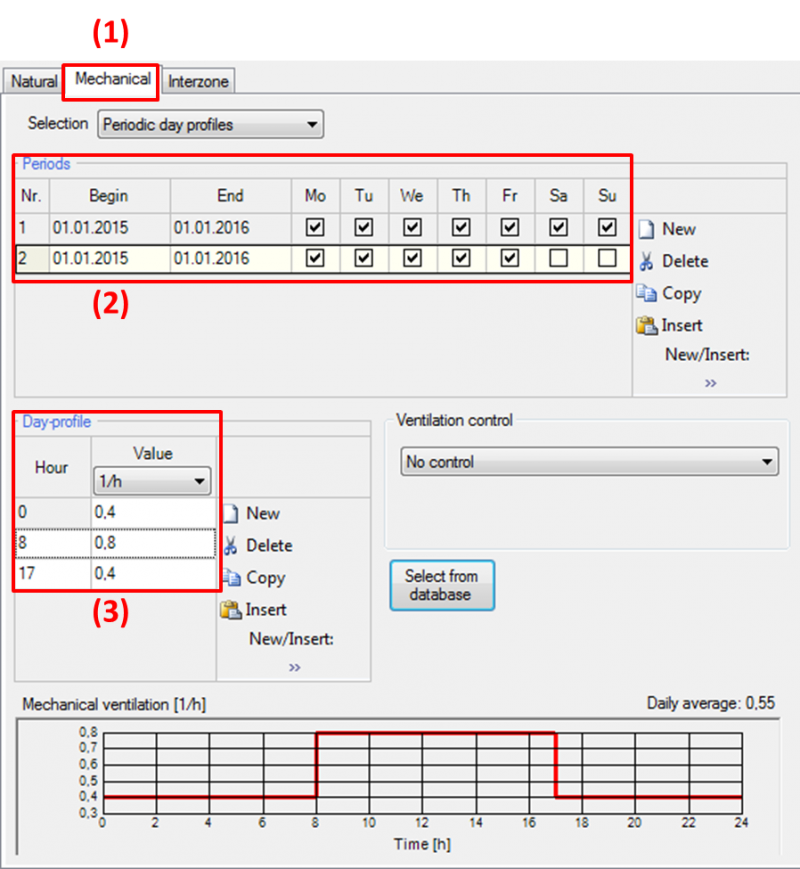
Next, the operation schedule for mechanical ventilation is defined. Switch to the “Mechanical”-tab (1). The ventilation system should provide a minimum air change rate of 0.4 h-1 at any time except the working hours (8am to 5pm from Monday to Friday) where it increases to 0.8 h-1. Enter these values by using periodic day-profiles (2 & 3) the same way as described in Step 07 and Step 08. In the end, the operation schedule for mechanical ventilation should look like this:
No input has to be made for interzone ventilation in this example.
	Always remember to include a mechanical ventilation device in the HVAC-dialog and assign it to the
	desired zone when defining schedules for mechanical ventilation. Else, these schedule can’t be executed.
Step 10: Climatic conditions in attached zone
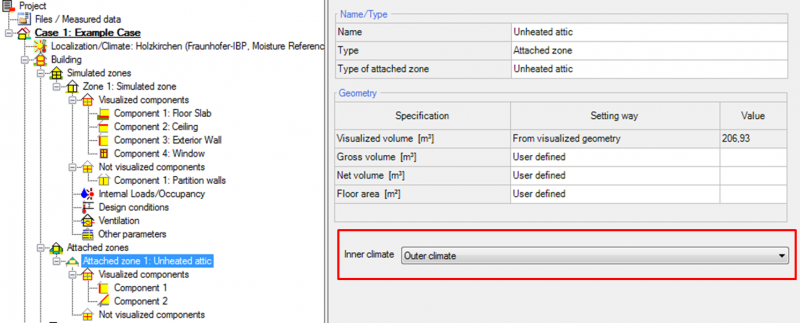
The climatic conditions in attached zones can be defined as an optional climate or they can be set to the outdoor climate. In this example, the latter option will be used for the unheated attic. Open the “Attached zone 1: unheated attic” in the “Project Tree” and alter the settings as in the figure below:
Step 11: Including HVAC
Now, the HVAC-system is defined. The example building needs devices for heating, cooling and mechanical ventilation, so the setpoints defined in Step 08 and the mechanical ventilation of Step 09 can be supplied.
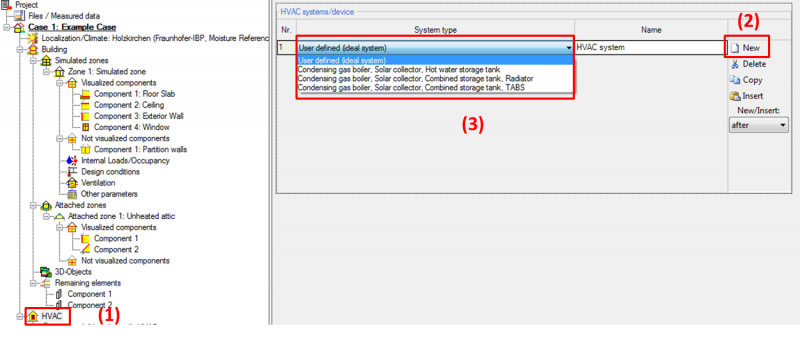
Select the “HVAC”-dialog (1) in the “Project Tree” and create a new HVAC-system by clicking the “New”-button (2). In this example, a custom system is used, so select the system-type “User defined (idealized)” (3).
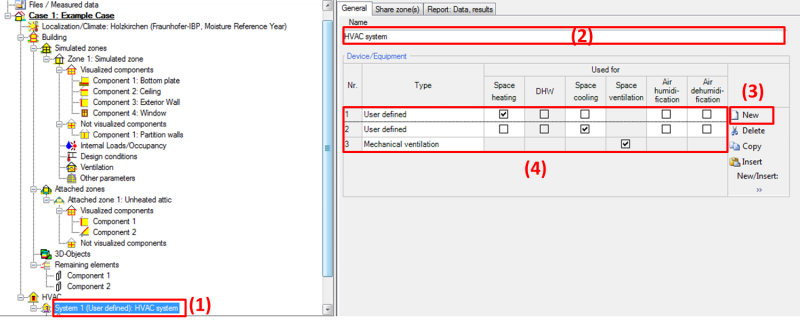
The new HVAC-system appears now in the “Project Tree” (1). Select it and the “HVAC-System”-dialog opens where the system can be named (2) and its different HVAC-devices can be added. Click the “New”-button (3) to add a HVAC-device and check mark its usage-type in the table (4). In this example three different devices are necessary: One for space heating, one for space cooling and a mechanical ventilation. In the end, the input for the HVAC-devices looks like this:
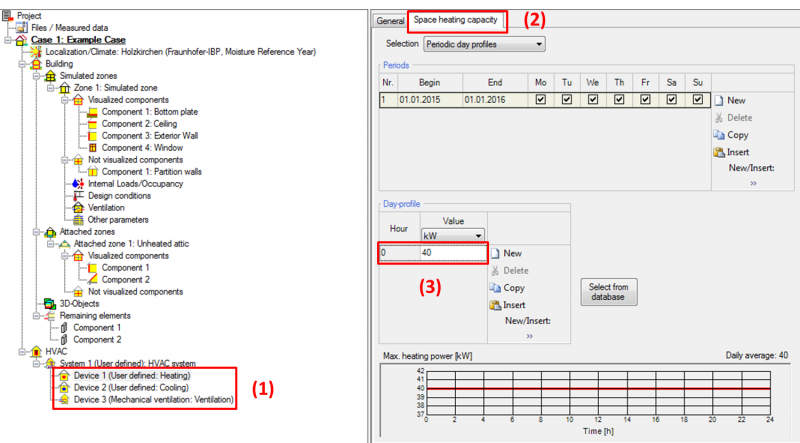
Each device is now also listed in the “Project Tree” (1). It can be selected and its properties can be altered to these constant values in (2 & 3):
- Space heating capacity: 40 kW
- Cooling capacity: 40 kW
- Ventilation capacity: 500 m³/h. Heat recovery rate of 60 %.
Step 12: Filling missing data
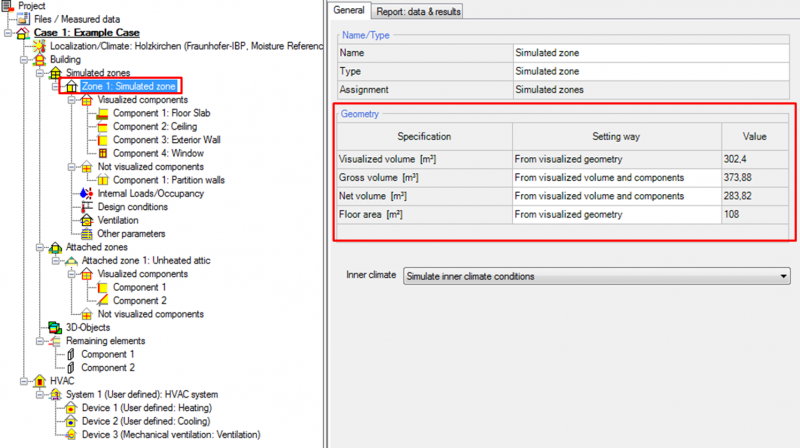
All necessary data should be entered by now. However, the “Status & Results Box” hints that some data is still missing. Double-clicking the “Status & Results Box” always guides you automatically to the source of the problem: Here, the net volume of the zone is still missing. Select the option “From gross volume and components” and WUFI® Plus calculates it automatically from the visual-ized geometry and the visualized components. However, this value should always be checked by the user if it was calculated correctly, as it has a huge impact on the calculations.
Step 13: Simulation
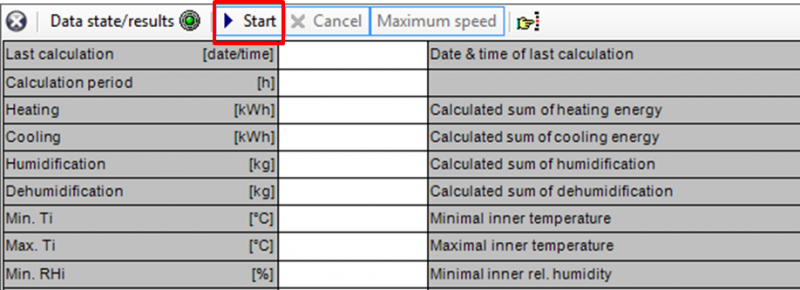
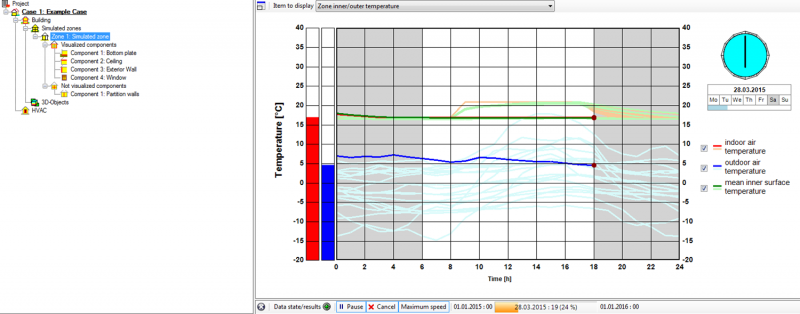
Now that really all necessary data is entered the “Status & Results Box” changes its appearance and the simulation can be started by clicking the “Start”-button:
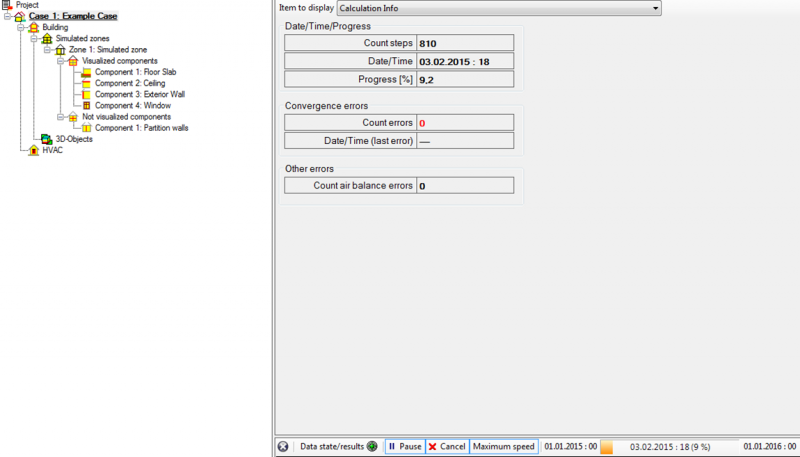
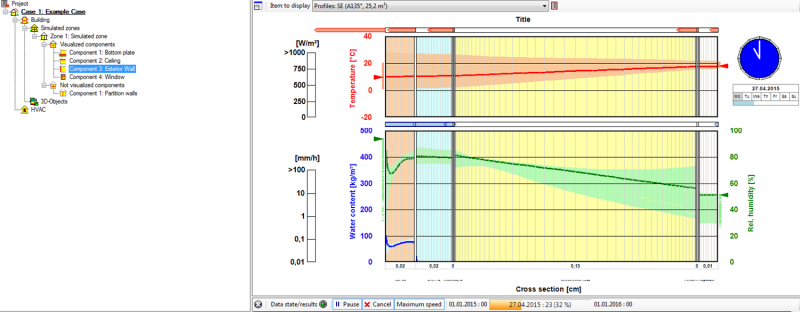
During a simulation the calculation process can be observed in many ways:
- A progress bar in the “Status & Results Box” shows the overall calcula-tion progress
- Selecting the “Case”-entry in the “Project Tree” gives a summary of the current calculation.
- Selecting a zone in the “Project Tree” shows graphs of current simula-tion results.
- Selecting a component in the “Project Tree” shows the WUFI® Film with the temperature and humidity conditions inside the component.
The visualizations during a simulation can be deactivated to increase calculation speed. To do this, click the “Maximum speed”-button in the “Status & Results Box”.
Step 14: Assessing the results
After the simulation is finished its results can be assessed in detail in WUFI® Plus. They can be exported to external applications, too. Also predefined reports can be viewed, printed and exported to Microsoft Word or Excel. Some exemplary evaluation methods are described below. Please refer also to chapter 9 of the manual, where all possibilities of working with WUFI® Plus results are described in more detail.
In this example results are available for the simulated zone and for each com-ponent. We will create a report and export it to Microsoft Office, view result graphs and export the calculation results as a text-file.
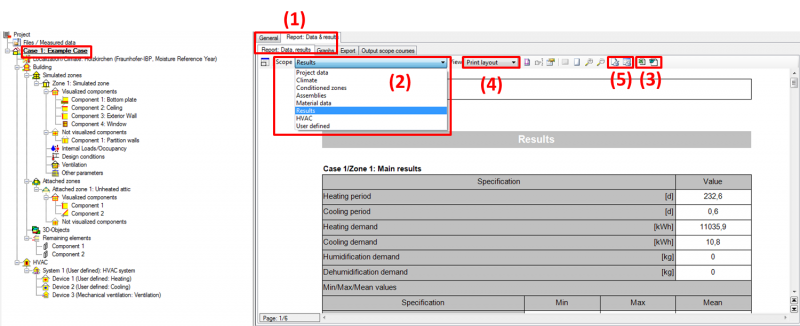
At first, a report with the general calculation results is viewed. Select the “Case”-dialog in the “Project Tree” and open the “Report: Data & results”-tab (1). Switch to different preset reports by changing the “Scope” (2). Select the “Results” report and have a look at the main results. All reports can be exported to Microsoft Excel and Word by clicking the respective buttons (3). To print a report change the view to “Print layout” (4) and click one of the “Print”-buttons (5).
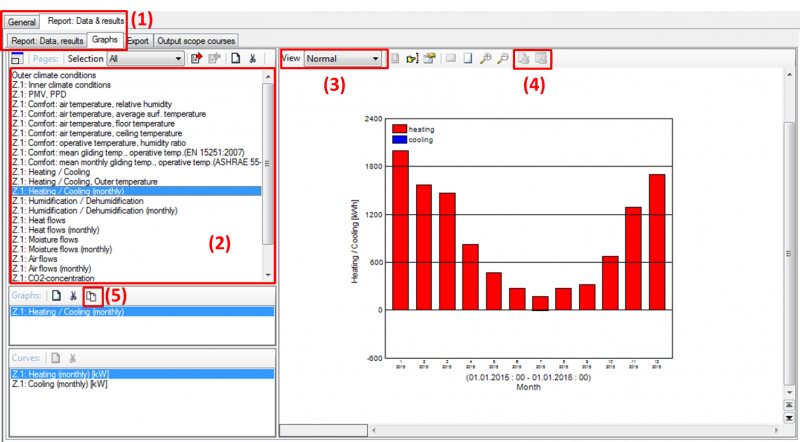
Next, graphs with the calculated hourly results are viewed. Switch to the “Graphs”-tab (1). Here, different preset graphs can be selected (2). Please have a detailed look at the simulation results and view the different graphs. The graphs can also be printed by changing the view to the print layout (3) and clicking one of the “Print”-buttons (4). With the “Copy to clipboard”-button (5) the active graph is copied and can be inserted in any other application.
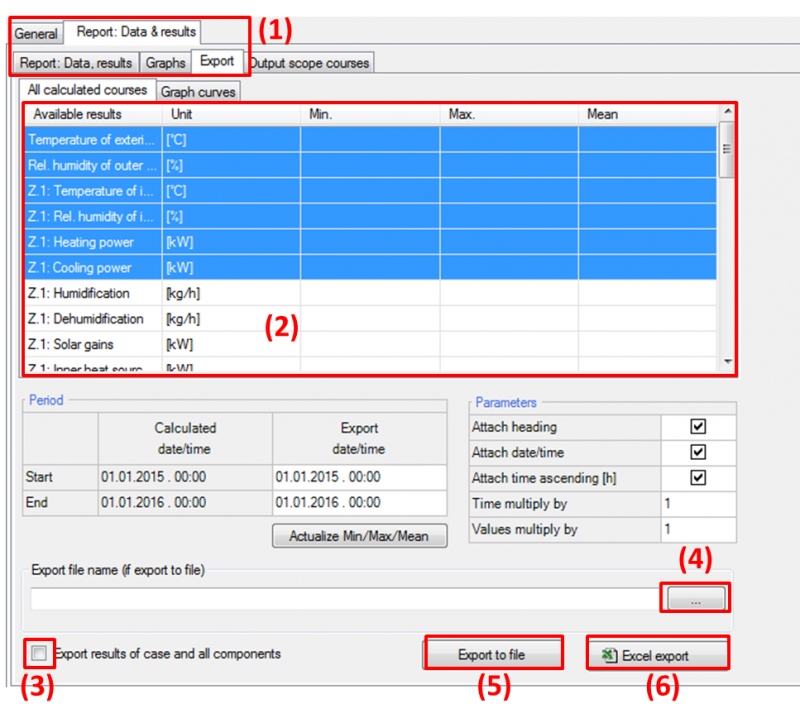
The results can also be exported to Microsoft Excel or as a text-file. These are powerful options to evaluate the calculated results as it enables the user to use external analysis programs. To export the calculation results switch to the “Export”-tab (1). The table (2) lists all available results that can be exported. Select multiple lines by clicking on them while pressing the “Ctrl”-key. These blue marked lines will be exported. Also an option exists which selects all available calculation results including results of components (3). To export the results to an external text-file, a save-path has to be created first (4). Afterwards, the results can be exported to this file by clicking the “Export to file”-button (5). The selected results can also be exported to Microsoft Excel by clicking the respective button (6). For this option no save path has to be defined and Excel starts automatically with the exported results.
As the “Retain calculation results”-option was activated in Step 05 for all components, their results can now be viewed. Also the WUFI® Film is saved for each component. To view the results of a component select it in the “Project Tree” and switch to the “Report: Data & results”-tab. There reports, graphs and the WUFI® Film of the component can be found in the respective tabs. The results can also be exported in the “Export”-tab. Now let’s have a look at the WUFI® Film of the exterior wall oriented in south-west direction. Select the respective component (1) and open the “Film”-tab in the “Report”-section (2). The dropdown-menu above the film allows switching through different grouped components (3). Select the south-western wall. This can also be done by clicking on the component in the “Visualization Box”. Now the film can be watched (4), exported as a movie-file in the .avi-format (5) or exported to the “Extended animation”-tool (6) that is shipped with WUFI® Plus. This external tool is an even more detailed assessment option for component results and serves as a bridge for postprocessors like for example WUFI® Bio, which allows the evaluation of mold growth risks on surfaces. Please refer to chapter 9.4 for further information about the capabilities of this tool.