Plus:HowTo: Unterschied zwischen den Versionen
Tes (Diskussion | Beiträge) |
Tes (Diskussion | Beiträge) |
||
| (39 dazwischenliegende Versionen desselben Benutzers werden nicht angezeigt) | |||
| Zeile 1: | Zeile 1: | ||
= | = Simulation procedure = | ||
This is a short description of a simulation procedure. | |||
For detailed information to the several steps follow the links. | |||
The elements in the [[Plus:Tree|navigation tree]] lead you step by step through all necessary inputs. | |||
* [[Plus: | |||
* [[Plus: | |||
[[Bild:WUFI-PlusNavigationTree1.jpg|left]] | |||
<br style="clear:both" /> | |||
== [[Plus:Dialog Project|Project]] == | |||
Start with the definition of the general [[Plus:Dialog Project|project]] information. | |||
[[Bild:Procedure_Project.jpg|left]] | |||
<br style="clear:both" /> | |||
== [[Plus:Dialog Files / Measured data|Files / Measured data]] == | |||
If [[Plus:Dialog Files / Measured data|additional data or files]] are needed for the calculation, load it into the programm. | |||
[[Bild:Procedure_Measured.jpg|left|700px]] | |||
<br style="clear:both" /> | |||
== [[Plus:Dialog Case|Case]] == | |||
Remark all alterations and characteristics of the current [[Plus:Dialog Case|case]] variation and define the simulation period. | |||
[[Bild:Procedure_Case.jpg|left]] | |||
<br style="clear:both" /> | |||
== [[Plus:Dialog Climate|Climate]] == | |||
Select the [[Plus:Dialog Climate|boundary conditions]]. This can be either a climate from the WUFIplus database or user defined. | |||
Additional optional climates can be defined (e.g. ground, attached zones). | |||
[[Bild:Procedure_Climate.jpg|left]] | |||
<br style="clear:both" /> | |||
== [[Plus:TreeBuilding|Building]] == | |||
Model the [[Plus:TreeBuilding|simulation building]]. | |||
For plain geometries use the 'building wizard' to generate the simulation envelope. For more complex geometries use the [[Plus:TreeBuilding|'3D editor']]. | |||
[[Bild:Procedure_Building.jpg|left]] | |||
<br style="clear:both" /> | |||
== [[Plus:TreeZones|Heated Zones]] == | |||
Create the several [[Plus:TreeZones|heated zones]] within the simulation envelope. | |||
[[Bild:Procedure_HeatedZones.jpg|left]] | |||
<br style="clear:both" /> | |||
== [[Plus:TreeHeatedZones|Zone]] == | |||
Make the stettings for the several [[Plus:TreeHeatedZones|zones]]. | |||
[[Bild:Procedure_Zone.jpg|left]] | |||
<br style="clear:both" /> | |||
== [[Plus:Visualized Components|Visualized Components]] == | |||
Allocate the [[Plus:Visualized Components|components]] to the respective zone. | |||
Define and asign the assemblies. | |||
Set the parameters for surface, initial conditions and numerics. | |||
[[Bild:Procedure_Component.jpg|left]] | |||
<br style="clear:both" /> | |||
== [[Plus:Inner Loads|Inner Loads]] == | |||
The occuring [[Plus:Inner Loads|inner loads]] by machines or occupants can be defined in profiles by the hour. | |||
[[Bild:Procedure_InnerLoads.jpg|left]] | |||
<br style="clear:both" /> | |||
== [[Plus:Design Conditions|Design Conditions]] == | |||
The [[Plus:Design Conditions|design conditions]] for the zone are defined by the hour as well. | |||
These values are setpoints for the HVAC system. | |||
[[Bild:Procedure_DesignConditions.jpg|left]] | |||
<br style="clear:both" /> | |||
== [[Plus:Other Parameters|Other Parameters]] == | |||
To start the calculation the initial conditions have to be defined. | |||
[[Bild:Procedure_OtherParameters.jpg|left]] | |||
<br style="clear:both" /> | |||
== [[Plus:HVAC - Heating, Ventilating, Air Conditioning|HVAC]] == | |||
Constitute the capability of the projected [[Plus:HVAC - Heating, Ventilating, Air Conditioning|HVAC system]]. | |||
[[Bild:Procedure_HVAC.jpg|left]] | |||
<br style="clear:both" /> | |||
== Calculation == | |||
Is the button red follow the path below to the missing or wrong input. | |||
A doubleklick on the given path leads automatically to the missing or wrong iput. | |||
[[Bild:Procedure_Calculationred.jpg|left]] | |||
<br style="clear:both" /> | |||
The completeness of the inputs is shown in the state bar with the green button. | |||
The caluculation can be started. It can be interrupted and then continued. With chosing a special component the current results of this component can be observed. A higher calculation speed "Maximum speed" is possible by hiding the current results. | |||
[[Bild:Procedure_Calculation.jpg|left]] | |||
<br style="clear:both" /> | |||
== [[Plus:Output|Results]] == | |||
[[Plus:Output|Results]] | |||
After a successful caluculation the results are available in different ways. | |||
*"[[Plus:Output#What do I get from WUFIplus?#Whole building#Data&Results|Report: Data&Results]]" | |||
The results are summarized in a report which's scope can be defined by the user | |||
*"[[Plus:Output#What do I get from WUFIplus?#Whole building#Graphs|Graphs]]" | |||
The results are diagrammed in graphs. | |||
*"[[Plus:Output#hat do I get from WUFIplus?#Whole building#WOutput|Export]]" | |||
The results can be exported to Ecxel or to file as calculated courses or graph curves. | |||
[[Bild:Procedure_Results.jpg|left]] | |||
<br style="clear:both" /> | |||
Aktuelle Version vom 11. Februar 2011, 10:32 Uhr
Simulation procedure
This is a short description of a simulation procedure.
For detailed information to the several steps follow the links.
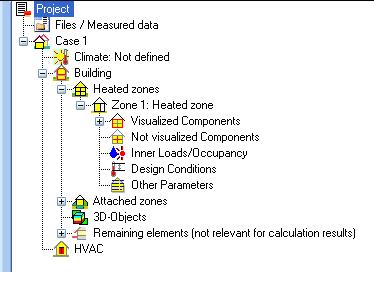
The elements in the navigation tree lead you step by step through all necessary inputs.
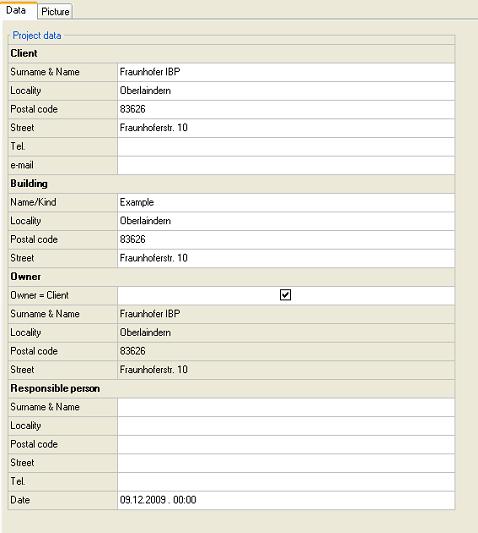
Project
Start with the definition of the general project information.
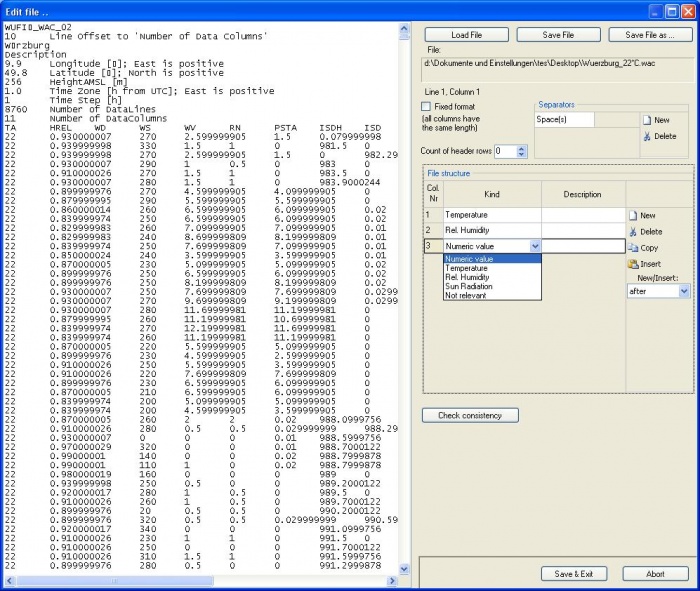
Files / Measured data
If additional data or files are needed for the calculation, load it into the programm.
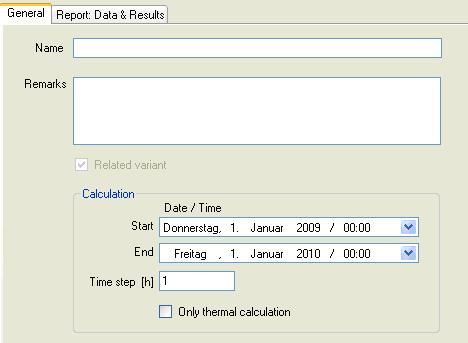
Case
Remark all alterations and characteristics of the current case variation and define the simulation period.
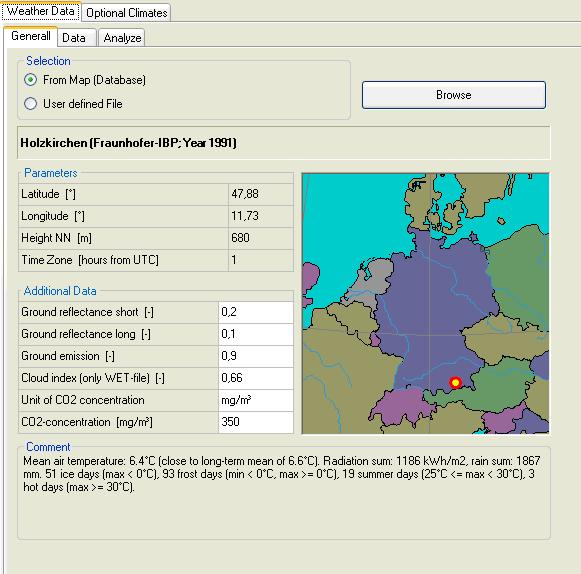
Climate
Select the boundary conditions. This can be either a climate from the WUFIplus database or user defined. Additional optional climates can be defined (e.g. ground, attached zones).
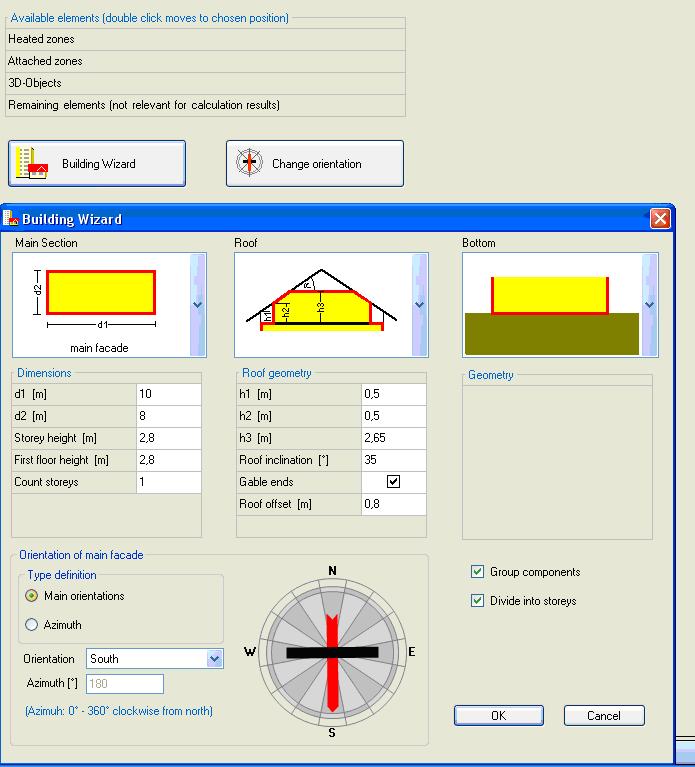
Building
Model the simulation building.
For plain geometries use the 'building wizard' to generate the simulation envelope. For more complex geometries use the '3D editor'.
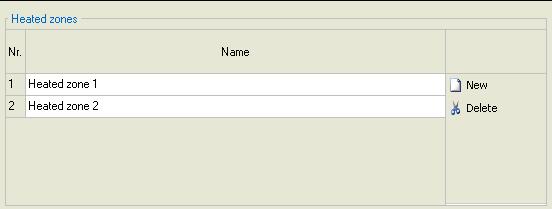
Heated Zones
Create the several heated zones within the simulation envelope.
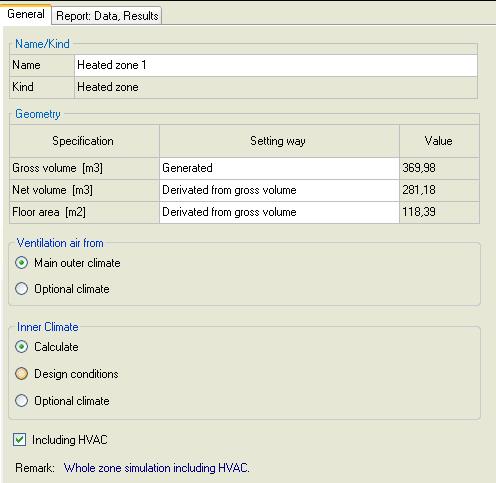
Zone
Make the stettings for the several zones.
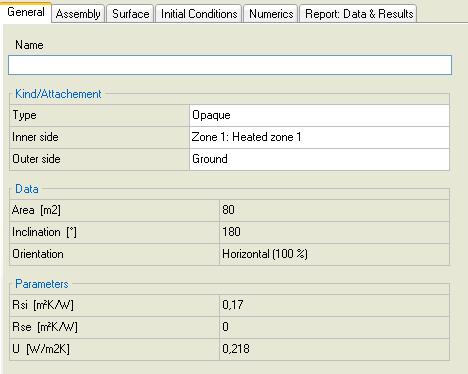
Visualized Components
Allocate the components to the respective zone.
Define and asign the assemblies.
Set the parameters for surface, initial conditions and numerics.
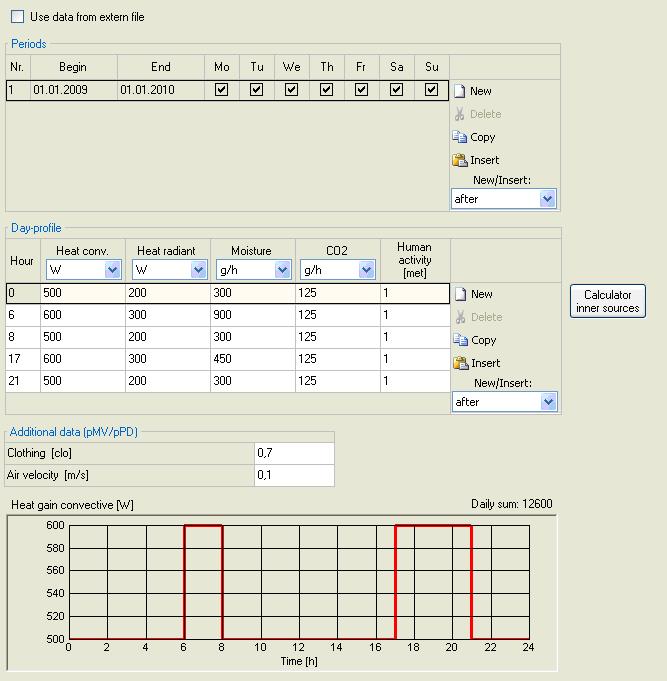
Inner Loads
The occuring inner loads by machines or occupants can be defined in profiles by the hour.
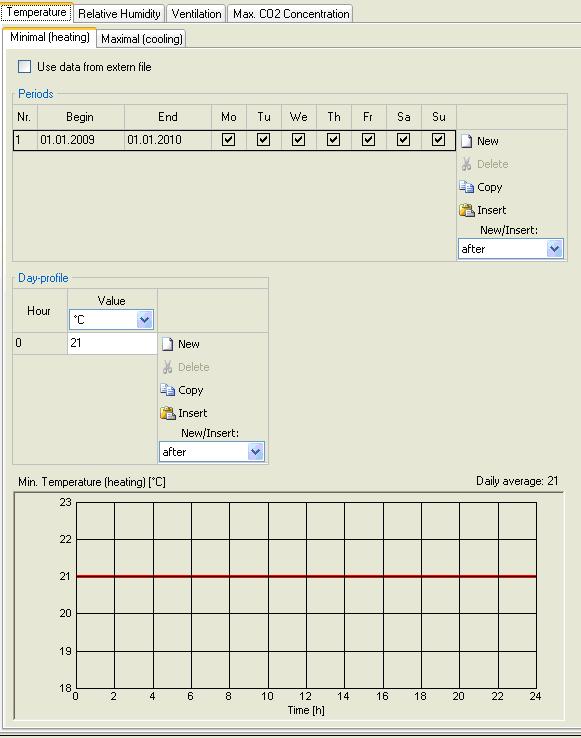
Design Conditions
The design conditions for the zone are defined by the hour as well.
These values are setpoints for the HVAC system.
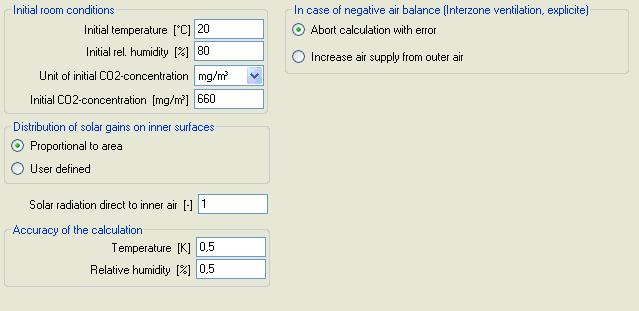
Other Parameters
To start the calculation the initial conditions have to be defined.
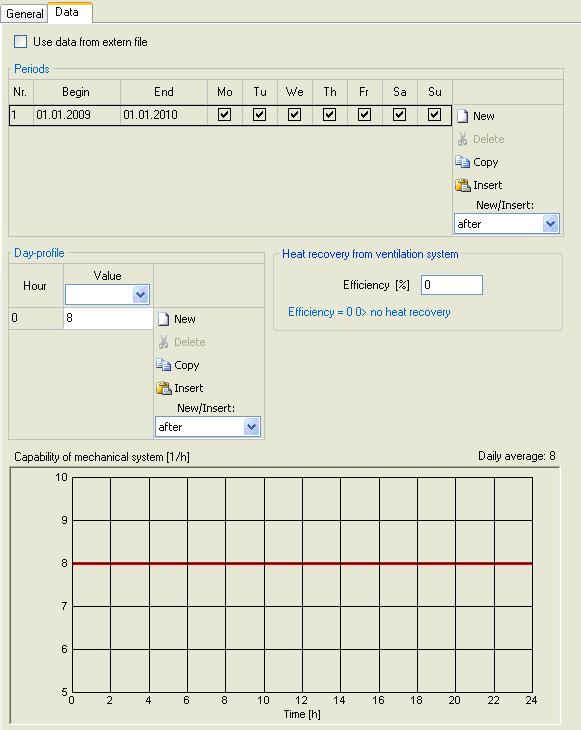
HVAC
Constitute the capability of the projected HVAC system.
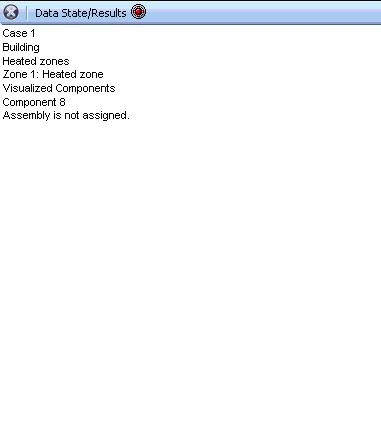
Calculation
Is the button red follow the path below to the missing or wrong input.
A doubleklick on the given path leads automatically to the missing or wrong iput.
The completeness of the inputs is shown in the state bar with the green button.
The caluculation can be started. It can be interrupted and then continued. With chosing a special component the current results of this component can be observed. A higher calculation speed "Maximum speed" is possible by hiding the current results.

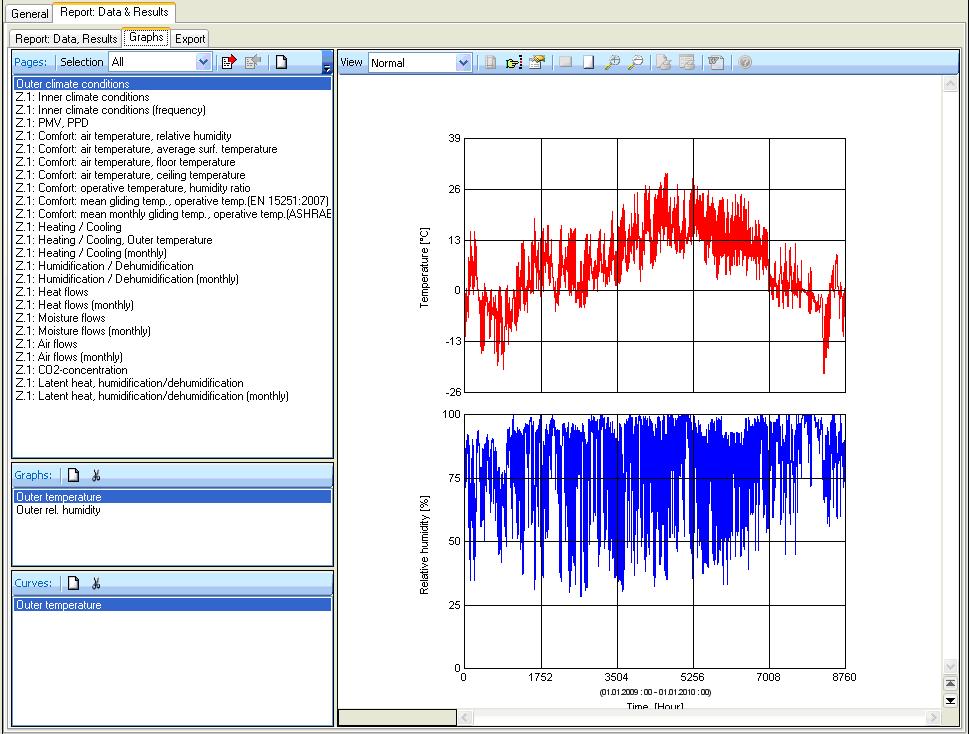
Results
After a successful caluculation the results are available in different ways.
The results are summarized in a report which's scope can be defined by the user
- "Graphs"
The results are diagrammed in graphs.
- "Export"
The results can be exported to Ecxel or to file as calculated courses or graph curves.
