1D:Dialog ResultGraphs: Unterschied zwischen den Versionen
Len (Diskussion | Beiträge) |
Len (Diskussion | Beiträge) |
||
| Zeile 334: | Zeile 334: | ||
* <B>Radiation:</B><BR> | * <B>Radiation:</B><BR> | ||
** <B>Solar Radiation:</B><BR> the solar radiation incident on the component surface, as dependent on the [[1D:Dialog_Orientation | inclination and orientation]] of the component (and not yet multiplied by the [[Details:ShortWave | short-wave radiation absorptivity]])<BR> <BR> | ** <B>Solar Radiation:</B><BR> the solar radiation incident on the component surface, as dependent on the [[1D:Dialog_Orientation | inclination and orientation]] of the component (and not yet multiplied by the [[Details:ShortWave | short-wave radiation absorptivity]])<BR> <BR> | ||
** <B>Counterradiation:</B><BR> the sum of [[Details: | ** <B>Counterradiation:</B><BR> the sum of [[Details:LongWaveExchange | terrestrial and atmospheric counterradiation]] incident on the component surface, as dependent on the [[1D:Dialog_Orientation | inclination]] of the component (and not yet multiplied by the [[Details:LongWave | long-wave radiation emissivity]] which determines the absorbed fraction of the incident radiation)<BR> <BR> | ||
** <B>Long-wave emission:</B><BR> | ** <B>Long-wave emission:</B><BR> | ||
the [[Details: | the [[Details:LongWaveExchange | thermal radiation]] emitted by the component surface<BR> | ||
<BR> | <BR> | ||
* <B>Air Temperature:</B><BR> | * <B>Air Temperature:</B><BR> | ||
Aktuelle Version vom 2. Oktober 2008, 08:38 Uhr
Dialog: Result Graphs
Of course, after the calculation you want to see the results. Besides the possibility to display a film, WUFI also offers the traditional display of the results as curves representing courses and profiles, formatted for printing.
You can view, edit and print graphics showing the calculated courses and profiles as well as the boundary conditions.
To this end, the graphics are assigned to several pages which hold one or several graphs each. Each graph displays one or several curves.
WUFI automatically assigns the most important curves to appropriate graphs and the
graphs to appropriate pages (see below how to display additional curves). So you
don't need to do anything; just open the present dialog "Result Graphs"
and view the individual results with a mouse click in the displayed list of pages.
You can choose from:
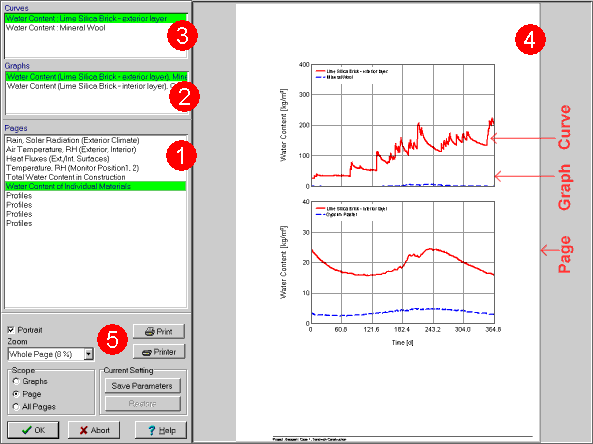
"Pages" (1):
This list shows all available pages.
Select the page you want to view or edit. WUFI immediately displays it in the right half of the screen (4).
A double-click on a page name in the list opens the subdialog "Page Setup" where you can edit the name of the page.
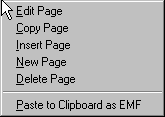
A right-click anywhere in the page list opens a context menu which allows you to edit the content of the page list:
| "Edit Page": | |
| Opens the subdialog "Page Setup" where you can edit the name of the page. |
|
| "Copy Page": | |
| Copies the highlighted page to an internal clipboard (not the Windows clipboard). |
|
| "Insert Page": | |
| Inserts the page in the internal clipboard in front of the highlighted page. This allows you to change the order of the pages in the list, or to create a copy of a page. |
|
| "New Page": | |
| Inserts an empty page at the end of the page list. |
|
| "Delete Page": | |
| Deletes the highlighted page. |
|
| "Paste to Clipboard as EMF": | |
| Copies the highlighted page or graph (depending on the "Scope" setting) to the Windows clipboard, in EMF (=Windows Enhanced Meta File) format. From there you can import it into a graphics editing program (such as Paintshop Pro, Photoshop etc). |
|
| Version notice: the editor functions are available in WUFI Pro only. |
"Graphs" (2):
This list shows all the graphs on the selected page.
Select the graph you want to view or edit. WUFI immediately displays it in the right half of the screen (4) (if the "Scope" is one graph only, otherwise all graphs on the page will be displayed anyway).
A double-click on a graph name in the list or on the displayed graph (4) opens the subdialog (either "Graph Setup: Courses" or "Graph Setup: Profiles") where you can edit the settings of the graph.
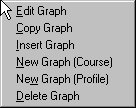
A right-click anywhere in the graph list opens a context menu which allows you to edit the content of the graph list:
| "Edit Graph:" | |
| Opens the subdialog (either "Graph Setup: Courses" or "Graph Setup: Profiles") where you can edit the settings of the graph. |
|
| "Copy Graph": | |
| Copies the highlighted graph to an internal clipboard (not the Windows clipboard). |
|
| "Insert Graph": | |
| Inserts the graph copied to the internal clipboard in front of the highlighted graph. This allows you to change the order of the graphs in the list, to create a copy of a graph or to move a graph between pages. |
|
| "New Graph (Course)": "New Graph (Profile)": |
|
| Inserts an empty graph at the end of the list. Choose the type of graph according to the type of the curves you want to display. |
|
| "Delete Graph": | |
| Deletes the highlighted graph. |
|
| Version notice: the editor functions are available in WUFI Pro only. |
"Curves" (3):
This list shows all the curves in the selected graph.
A double-click on a curve name in the list opens the subdialog "Curves Setup" where you can edit the settings of the curve.
A right-click anywhere in the curve list opens a context menu which allows you to edit the content of the curve list:
| "Edit Curve:" | |
| Opens the [[1D:Dialog_CurvesSetup.htm">subdialog "Curves Setup"</A> where you can edit the settings of the curve. |
|
| "Insert Curve": | |
| Opens the subdialog "InsertCurves" from which you can select a curve for insertion into the curve list. |
|
| "Delete Curve": | |
| Deletes the highlighted curve. |
|
| Version notice: the editor functions are available in WUFI Pro only. |
"Portrait" (5):
Check this option to get the pages in portrait orientation; uncheck it to get them
in landscape orientation.
"Zoom" (5):
Select the zoom factor of the displayed page (20% .. 200%. "Page Width"
will use exactly the width of the display area (4);
"Whole Page" will use exactly the height of the display
area (4)).
"Scope" (5):
Decide if WUFI is to draw one graph only or the whole page. The
option "All Pages" applies to printer output only.
"Print" (5):
Press this button to print the current graph or page or all pages (depending on
the "Scope" setting).
"Printer" (5):
Press this button to open a subdialog where you can edit the printer settings.
"Current Setting" (5):
| "Save Parameters": | |
Saves the current graphics settings. |
|
| "Restore": | |
Restores the previously saved graphics settings. |
The following courses are displayed automatically:
- Rain:
the driving rain load incident on the component surface, as dependent on the inclination and orientation of the component (and not yet multiplied by the rain reduction factor)
- Radiation:
- Solar Radiation:
the solar radiation incident on the component surface, as dependent on the inclination and orientation of the component (and not yet multiplied by the short-wave radiation absorptivity)
- Counterradiation:
the sum of terrestrial and atmospheric counterradiation incident on the component surface, as dependent on the inclination of the component (and not yet multiplied by the long-wave radiation emissivity which determines the absorbed fraction of the incident radiation)
- Long-wave emission:
- Solar Radiation:
the thermal radiation emitted by the component surface
- Air Temperature:
the air temperatures on both sides of the component
- Relative Humidity:
the relative humidities of the air on both sides of the component
- Heat Fluxes:
the heat flux densities through both surfaces of the component
- Moisture Fluxes:
the moisture flux densities (liquid transport + vapor transport) through both surfaces of the component
- Temperature, Relative Humidity (Monitoring Position xx):
the variation in time of temperature and relative humidity at the monitoring positions
- Water Content of Individual Materials:
the water content of the individual material layers of the component (different layers which contain the same material are represented by different curves)
- Total Water Content in Construction:
the water content in the entire component,
as well as the profiles of temperature,
relative humidity and water content for beginning and end of the calculation,
and for further selected points in time, if any have been
specified.
In addition, further curves can be displayed, such as
- the different radiation components,
- the variation in time of the heat transfer and vapor transfer coefficients,
- the heat and moisture fluxes between the layers,
- the source strengths of heat or moisture sources,
- the barometric pressure
- etc.
In order to display these curves, create a new page by right-clicking in the
"Pages" list, create a new graph on that page by right-clicking on the
"Graphs" list and a new curve in this graph by right-clicking on the
"Curves" list.
For the first curve assigned to the graph
you can select the type of curve (e.g. temperature, moisture source etc.). A
list will then display the available curves of this type for selection.


