Plus 2.X:Results
Once you have supplied WUFIplus with the needed data it can calculate the temporal evolution of the temperature and moisture fields in the building components and the inner climate conditions. There are general results for the whole building and results for each individual component.
Whole Case
Results for the whole building can be found under the respective case entry in the Navigation Tree after the calculation under Report: Data & Results.
There are three subsections:
Report: Data & Results
A couple of operations are possible in the Results Tab, see the picture above for the different buttons.
- Expand/Shrink Window: Before working with the results you might want to expand the results window to full screen size.
- Page Setup: The Page Setting/Preferences Window opens and paper size, top and side margins can be altered. Else under preferences you can decide whether you want to start new topics on new pages and whether or not you want to allow breaking of tables (the Page Setup button only works if View is changed to print setup)
- Scope/Sequence: See scope user defined to learn more about this button
- Options: Colors of the illustration can be changed using the Options button
- Whole Width: Clicking this button the whole width of the window is used to display the results
- Whole Page: Clicking this button the whole page you are looking at is displayed
- Zoom in and out: to enlarge or lessen the size of the illustration
- Print all: Has the whole selected scope printed by your default printer. (This button only works if View is changed to print setup)
- Print dialog: Click here to open the print dialog. Select a printer, for changing the printer options click the "Preferences" Button, "Find printer..." opens a dialog that helps you find a suitable printer that is able to meet the requirements. Also the page range and the number of copies can be altered. (The button only works if View is changed to print setup)

- Export in Word: This Button is not implemented yet.
- Help: This Button is not implemented yet.
There are different scopes with different contents to choose under Data&Results:
- Project data: The general information about the project that can be entered under the Project entry in the Navigation Tree
- Climate: Some basic information about the outer climate you chose under Climate
- Conditioned zones: Overview on important information you entered for the zones (geometry, other parameter, accuracy...) and the components (geometry, surface, numerics...) belonging to those.
- Assemblies: Overview on the assemblies used in the project. All important values on different layers and the whole assembly are displayed
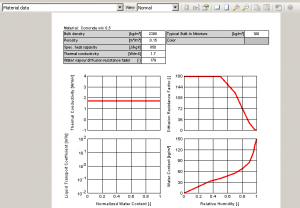
- Material data: More detailed values and graphs on the materials used in the project
These first five entries can be viewed before the calculation, too, as they are just a illustration of data entered by the user.
- Results: A overview on the results for the different zones and components containing
- Mould grow conditions: the total sum [h] and the continous hours of favourable conditions to mould growth for the components of each zone

- User defined: A user defined composition of information can be generated. Click the Scope/Sequence button to open the Scope/Sequence window. There you can decide which parts of the results you want to include into your user defined assembly. Elements on the left are chosen elements, therefore are part of the user defined assembly, scopes on the right side are available but not chosen. To switch elements just move them using drag and drop. As well with the "Select all" button, all elements can be moved to the respective side. Click "OK" when your selection is finished.
Graphs
The Graphs tab offers a lot of opportunities, too. For the buttons see the picture above.
- Expand/Shrink window: You can Expand and Shrink the Graphs window with this button.
- Selection: you can choose which selection of graphs you want to have displayed, all graphs, or those either concerning Climate, Comfort, Energy or Humidity.
*Retain current settings
*Restore retained settings
*New page
*Delete current page
- Copy to Clipboard: Copies the selected page to the clipboard and consequently allows pasting of the corresponding graphs and curves.
- Page Setup: The Page Setting/Preferences Window opens and paper size, top and side margins can be altered. Else under preferences you can decide whether you want to start new topics on new pages and whether or not you want to allow breaking of tables (the Page Setup button only works if View is changed to print setup)
*Scope/Sequence:
- Options: Colors of the illustration can be changed using the Options button
- Whole Width: Clicking this button the whole width of the window is used to display the results
- Whole Page: Clicking this button the whole page you are looking at is displayed
- Zoom in and out: to enlarge or lessen the size of the illustration
- Print all: Has the whole selected page printed by your default printer. (This button only works if View is changed to print setup)
- Print dialog: Click here to open the print dialog. Select a printer, for changing the printer options click the "Preferences" Button, "Find printer..." opens a dialog that helps you find a suitable printer that is able to meet the requirements. Also the page range and the number of copies can be altered. (The button only works if View is changed to print setup)

- Export in Word: This Button is not implemented yet.
- Help: This Button is not implemented yet.
There are three blocks on top of each other, the uppermost is the pages block (you can choose your desired selection there, as above mentioned) where you can select the different graphs of the selection you have chosen. The Z and the number in front of the pages stands for the respective zone (Z.1 = Zone 1). The second is the graphs block where all graphs belonging to the page you selected above are displayed and the third is the curves block, where all curves belonging to the graphs are listed.
Operations
Export
Heated Zones
The results Section for the individual zones is very similar to that of the whole case. Logically the results and graphs sections for one zone only contains results and graphs concerning this special zone whereas the whole composition of all results can be found in the cases' results section.
Export of data however is only possible in the case section.
For more information on how to work with results and graphs see the cases' results chapter.
Individual Components
Before the calculation "retain calculation results" can either be check marked or not for every component. If it is chosen, all films and graphics are saved for the respective component. However note that this claims lots of memory.
Opaque components
No retaining of calculation results
If the box wasn't check marked, you can find the following scopes under Results
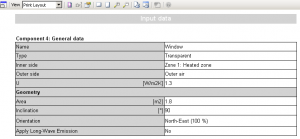
- Input data: contains general data concerning the component and information on the assembly. Input data can already be found in the results before the calculation, of course
- Material data:Contains information on the materials used in this component with values and graphs

- Results:Min/Max/Mean values, U-effective, values for solar radiation for each opaque component.

- There is also a user defined scope. For explanation on how to create a user defined results scope and for explanation on the buttons see the cases' results chapter.
Retaining of calculation results
If the "retain calculation results" box was check-marked results like described above in "no retaining of calculation results" plus three additional subsections can be found after the calculation:
- Graphs: Graphs concerning the component can be found here. To distinguish between graphs for different components the orientation, the azimuth and the area of the component is listed in the name of each graph (for example: S-E(A135°, 25.2m2)).On further information on how to work with graphs and buttons see the cases' results chapter.

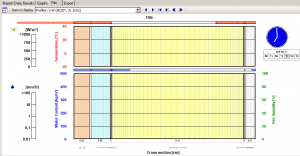
- Films: The films that show temperature and relative humidity inside the component and that can be watched during the calculation (if "show results" is chosen) are retained as well. If several components are grouped together the requested one can be selected under "Item to display".
![]() : Back and Forward button. Makes the film run back and forward. To stop it click the Stop button
: Back and Forward button. Makes the film run back and forward. To stop it click the Stop button ![]() . Watch the clock and date on the right side for temporal orientation.
. Watch the clock and date on the right side for temporal orientation.
![]() :Back 1 step and Forward on step button. Clicking these buttons makes the film jump one hour back or forward.
:Back 1 step and Forward on step button. Clicking these buttons makes the film jump one hour back or forward.
![]() : Scroll to start and Scroll to end button allow jumping to start and end of calculation period.
: Scroll to start and Scroll to end button allow jumping to start and end of calculation period.

- Export: Check the cases' results chapter for further information on the export section.
Windows
No retaining of calculation results
If "retain calculation results wasn't check-marked all that is retained for a window is a composition of general data.

Retaining of calculation results
If the "retain calculation results" box was check-marked results like described above in "no retaining of calculation results" plus two additional subsections can be found after the calculation:
- Graphs: A graph for the overhang shading factor is created. For more information in working with graphs see the cases' results chapter.
- Export: Check the cases' results chapter for further information on the export section.


