Passive:Verification
Results of Passive House Verification
This page shows the different sections of the Passive House Verification output report. There will be a short description of the output parameters for each section as well as a screenshot.
Building Information
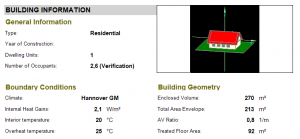
The first section summarizes general information about the building itself and important boundary conditions such as the interior temperature and the internal loads.
Passivehouse requirements
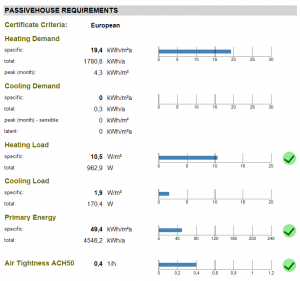
The primary passive house requirements depend mostly on energy demand, mainly in form of cooling and heating as well as primary energy demand. All values are given in a specific value (per square meter/feet) and in total. Heating and cooling demand also provide a peak value(month), which is estimated by the extreme weather conditions in the climate tab.
Passivehouse Recommendations

The recommendations consist of the HRV efficiency and a percentage chance of overheating of the building. Depending on the likelihood of overheating, WUFI®Passive will give recommendation if a separate cooling system is needed or not.
Building Elements
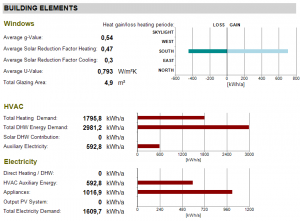
The building elements describes the influences of windows, HVAC systems and electric devices on the energy demand.
Windows
The graphic shows the heat losses and gains of solar radiation through windows separated by orientation. Also average U-values for all windows are given as well as the total glazing area.
HVAC
The energy demand of all HVAC devices is summarized here.
Electricity
The energy demand of all other electric devices is listed here.
Heat Flow

Heat gains and losses are divided into different categories.
Heat gains are separated into solar gains, inner sources, thermal bridges and mechanical heating.
Heat losses are separated into windows & doors, the opaque building envelope, natural ventilation and mechanical ventilation.
Both statistics are displayed in a pie chart.
Climate
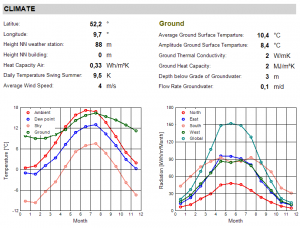
Here you find local climate conditions e.g. the height of the building and ground conditions.
Furthermore there is a graphical overview of the climate given in the localization/climate section and possible calculations of undefined values (e.g. ground/sky temperatures).
The second graph displays the solar radiation separated by orientation.
Calculation Parameters
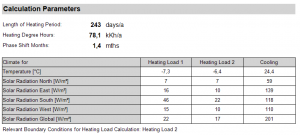
The main boundary conditions for the heat loss calculation are listed here.
Here you will also find the extreme weather conditions for the calculation of the heating/cooling load. For the heating load there are two possible climates available. The relevant climate (the climate with higher calculated heating load) is displayed on bottom.
Annual Heat/Cooling Demand

This displays the balance between annual heat gains and losses and thereby calculates the annual heat/cooling demand.
The losses/gains are summarized by categories and their balance is graphically displayed on the bottom.
Note: the heat gains during heating period and the heat losses during the cooling period are reduced by the Utilization Factor. The Utilization Factor is estimated by a complex calculation.
Heating/Cooling Load
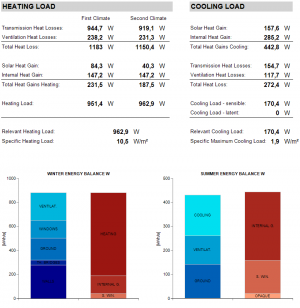
Apart from the Utilization Factor, the calculation is similar to the heating/cooling demand calculation. The results are based on the extreme weather conditions shown above. For the heating load, two possible weather conditions are investigated and the worst case is taken.
Areas
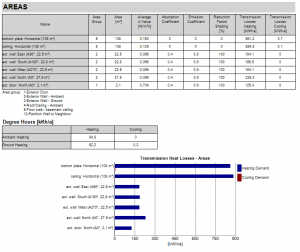
For each component the most important values are displayed in tabular and graphical form. The results are used for the heating/cooling demand calculation.
Thermal Brigdes
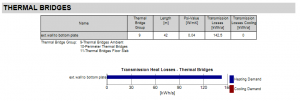
Summarizes all thermal bridges given in the thermal bridge tab of the navigation tree. This also displays the heat gains and losses resulting from the thermal bridges.
Windows
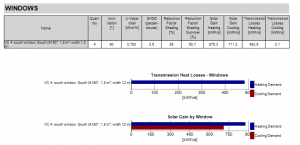
Shows the number, orientation and specific values of all windows and their influence on the heat gains and losses. These results are used in the calculation of the heating and cooling demand.
Summary Building Envelope
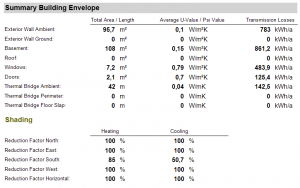
This displays dimensions of all building elements as well as their U- or Psi-Value. It also shows the transmission losses of each element, which are also needed for the balance of heat gains and losses.
The respective final shading reduction factors for both the heating and cooling periods are shown here, separated by orientation.
HVAC Systems
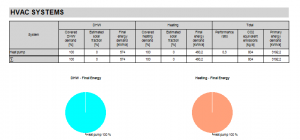
This table displays an enumeration of all HVAC systems and their influence on the DHW consumption, heat gains/losses and primary energy demand. Also displayed is a value for the equivalent CO2 emissions.
Ventilation

All relevant values for the mechanical and natural ventilation are displayed here. If there is more than one ventilation unit, the total efficiency of the ventilation system as well as the individual units are listed on bottom. Those values also depend on the supply and exhaust duct lengths and their insulation levels.
Electricity Demand - Auxiliary Electricity

A table containing the auxiliary energy demand of all HVAC and affiliated systems.
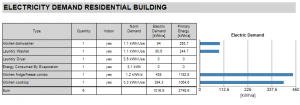
Electricity Demand Of Electric Devices
A list of all input electric devices and their annual electric demand.
WUFI has different graphics for residential and non-residential buildings.
Internal Heat Gains

Internal Heat Gains can either be calculated by entering project specific data for devices, lighting, etc. or, a general predefined default value may be used. The default values are shown below.
Dwelling: 2.1 W/m²
Home for elderly/students: 4.1 W/m²
Office/administrative building: 3.5 W/m²
Schools: 2.8 W/m²
DHW and Distribution
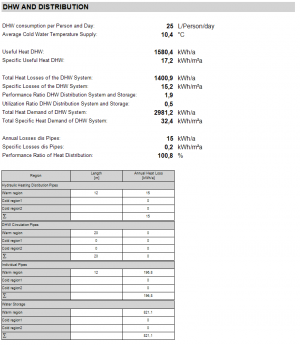
The relevant data for DHW distribution is shown in this section.
A list of all distribution pipes and water storage devices can be found here as well.
